PROTECTED SOURCE SCRIPT
OGT Trend Dashboard
What Is The OGT Trend Dashboard?
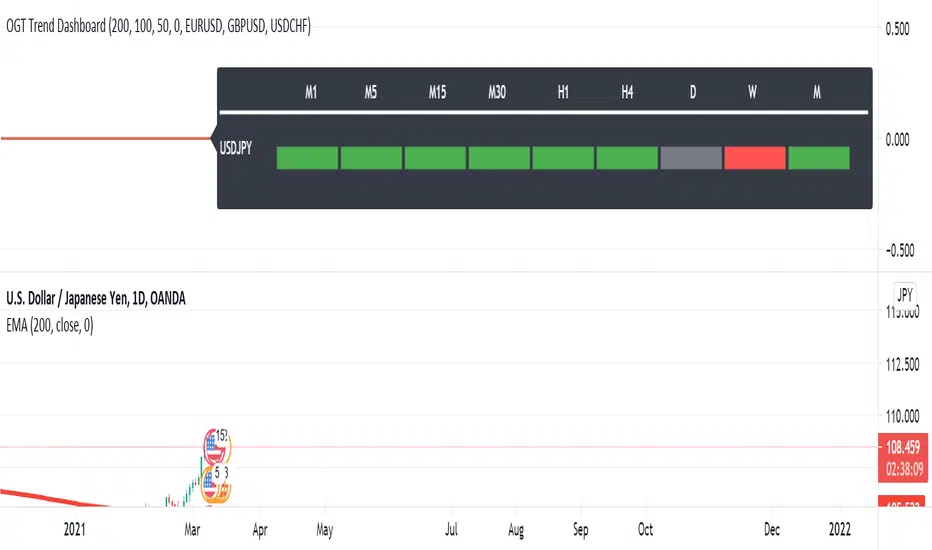
The One Glance Trader (OGT) Trend Dashboard is a trend indicator that visualises if a stock, currency pair etc. is trending (up/down) on multiple time frames. The aim of the dashboard is to provide a "one glance" view for a custom list of symbols to show a clear trend bias. A green timeframe signals it is in a up trend, red for a down trend and grey for no clear trend direction. The indicator uses 3 EMAs (fast, medium slow) to define whether a symbol is trending or ranging. The 3 EMAs periods can be defined by the user.
Indicator Settings
- Fast, medium and slow EMA periods
- Symbols (up to 4 can be selected). First symbol will always be the chart the indicator is applied to
- Alerts - select for all symbols you want alerts so (historic alerts for the first symbol will be visually applied on the chart)
- Timeframes ( M1 to Monthly)
Alerts - You can create alerts for any of the 4 pairs when all timeframes selected are trending up (green) or down (red).
How To Use the OGT Trend Dashboard
- Entry Signal For Trends: When all desired timeframes are either trending up/down enter the market in the direction of the trend
- Determine Trend Bias: Use the dashboard to complement existing trend trading systems as added confirmation
Script protetto
Questo script è pubblicato come codice protetto. Tuttavia, è possibile utilizzarle liberamente e senza alcuna limitazione – ulteriori informazioni qui.
Declinazione di responsabilità
Le informazioni e le pubblicazioni non sono intese come, e non costituiscono, consulenza o raccomandazioni finanziarie, di investimento, di trading o di altro tipo fornite o approvate da TradingView. Per ulteriori informazioni, consultare i Termini di utilizzo.