OPEN-SOURCE SCRIPT
Acceleration Bands
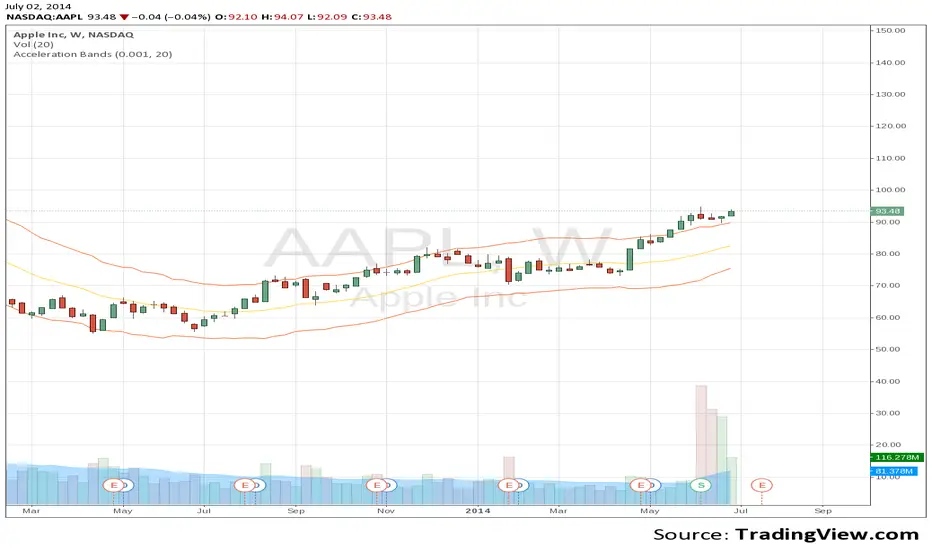
Price Headley\'s Acceleration Bands serve as a trading envelope that factor in a stock\'s typical volatility over standard settings of 20 or 80 bars. They can be used across any time frame, though Headley prefers to use them most across weekly and monthly timeframes as breakout indicators outside these bands, while using the shorter time frames to define likely support and resistance levels at the lower and upper Acceleration Bands. Acceleration Bands are plotted around a simple moving average as the midpoint, and the upper and lower bands are of equal distance from this midpoint.
swingtracker.com/content.php?content=technical_accband
forex-indicators.net/acceleration-bands
swingtracker.com/content.php?content=technical_accband
forex-indicators.net/acceleration-bands
Script open-source
In pieno spirito TradingView, il creatore di questo script lo ha reso open-source, in modo che i trader possano esaminarlo e verificarne la funzionalità. Complimenti all'autore! Sebbene sia possibile utilizzarlo gratuitamente, ricorda che la ripubblicazione del codice è soggetta al nostro Regolamento.
Declinazione di responsabilità
Le informazioni ed i contenuti pubblicati non costituiscono in alcun modo una sollecitazione ad investire o ad operare nei mercati finanziari. Non sono inoltre fornite o supportate da TradingView. Maggiori dettagli nelle Condizioni d'uso.