Stochastic Momentum Triangles[TheJackrabbit]
**Stochastic Momentum Triangles[TheJackrabbit]** is a custom indicator designed to integrate multiple dimensions of market momentum into a single, visual framework. Rather than relying on generic oscillators, this tool brings together stochastic calculations, price mapping, velocity measurement, and dynamic visual feedback to offer a layered view of market conditions.
#### Key Features and Components
- **Stochastic Calculations Mapped to Price Levels**
The indicator starts by computing the traditional stochastic oscillator values—%K, %D, and %J—over a user-defined period. These values are then mapped to the current price range. This mapping is achieved via a dedicated function that uses an exponential moving average and a rounding option, thereby linking momentum metrics directly with price dynamics.
- **Momentum Velocity and Its RSI**
To quantify the rate of change, the script calculates a “velocity” by measuring the difference in the price-mapped stochastic values over a specified lookback period. The resulting velocity values are then processed through a Relative Strength Index (RSI) calculation. This additional layer helps to provide a clearer picture of how rapidly market momentum is changing.
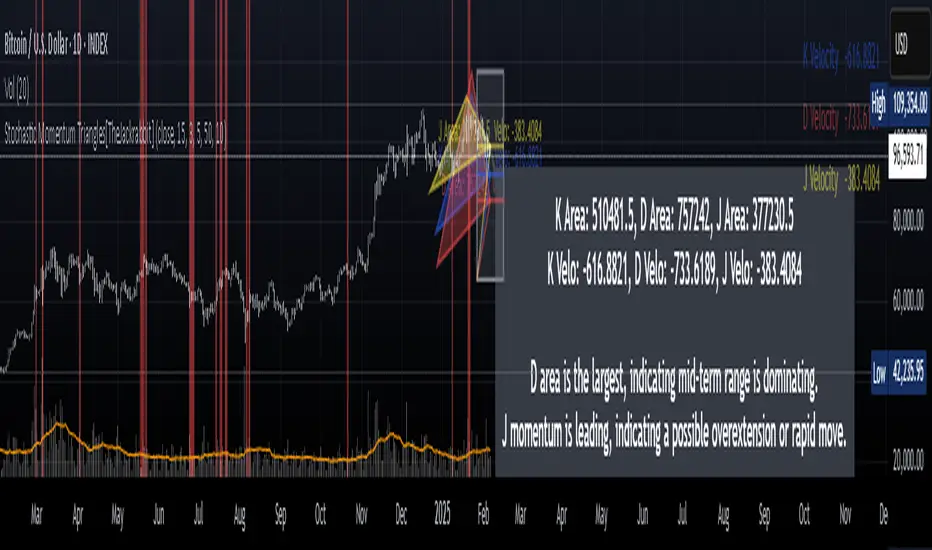
- **Triangle Area Measurement as a Volatility Proxy**
For each of the K, D, and J series, the indicator identifies the highest and lowest values within a user-specified lookback window and constructs triangles by connecting these extremes with the current value. The area of these triangles is computed, serving as an abstract measure of volatility and the range of price momentum. These areas are displayed alongside the velocity readings in an on-chart table for easy reference.
- **Dynamic Interpretation Label**
The tool also generates a concise reading in English that summarizes the relationships among the areas and velocity values. For example, it notes when one series, such as J, exhibits both the largest triangle area and the highest velocity. In such cases—suggesting an extended move or potential overextension—the label’s text color changes (to red) to visually alert the trader to an increased likelihood of a reversal. This approach allows traders to quickly assimilate the indicator’s data without overwhelming them with subjective language.
- **Additional Visual Elements**
Beyond the core calculations, the indicator includes a “momentum box” that captures the range of the stochastic-derived values over recent bars, as well as radial lines that provide a visual connection from the box’s reference point to current values. These elements together offer a structured, multi-faceted view of market dynamics.
#### Significance and Effects
This indicator takes a measured approach to integrating multiple aspects of market analysis. By combining price-based mapping with traditional stochastic and momentum measurements, it provides traders with:
- **A structured framework** to assess market range and momentum changes.
- **Visual cues** (such as the dynamic label and color changes) that highlight conditions warranting closer attention.
- **Tangible, calculated metrics**—triangle areas and velocity RSIs—that may assist in identifying potential reversal points.
Stochastic Momentum Triangles[TheJackRabbit] is intended to serve as a supplementary tool for traders who appreciate a quantitative perspective on market behavior. Its design focuses on clear, measurable outputs rather than relying on broad claims, allowing for a calm and thoughtful evaluation of market conditions.
Turn HideKDJLine to False if you want to visually confirm them.
Script su invito
Solo gli utenti approvati dall'autore possono accedere a questo script. È necessario richiedere e ottenere l'autorizzazione per utilizzarlo. Tale autorizzazione viene solitamente concessa dopo il pagamento. Per ulteriori dettagli, seguire le istruzioni dell'autore riportate di seguito o contattare direttamente jackrabbitrage.
TradingView NON consiglia di acquistare o utilizzare uno script a meno che non si abbia piena fiducia nel suo autore e se ne comprenda il funzionamento. È inoltre possibile trovare alternative gratuite e open source nei nostri script della community.
Istruzioni dell'autore
Declinazione di responsabilità
Script su invito
Solo gli utenti approvati dall'autore possono accedere a questo script. È necessario richiedere e ottenere l'autorizzazione per utilizzarlo. Tale autorizzazione viene solitamente concessa dopo il pagamento. Per ulteriori dettagli, seguire le istruzioni dell'autore riportate di seguito o contattare direttamente jackrabbitrage.
TradingView NON consiglia di acquistare o utilizzare uno script a meno che non si abbia piena fiducia nel suo autore e se ne comprenda il funzionamento. È inoltre possibile trovare alternative gratuite e open source nei nostri script della community.