PROTECTED SOURCE SCRIPT
Aggiornato 1st FVG
Overview
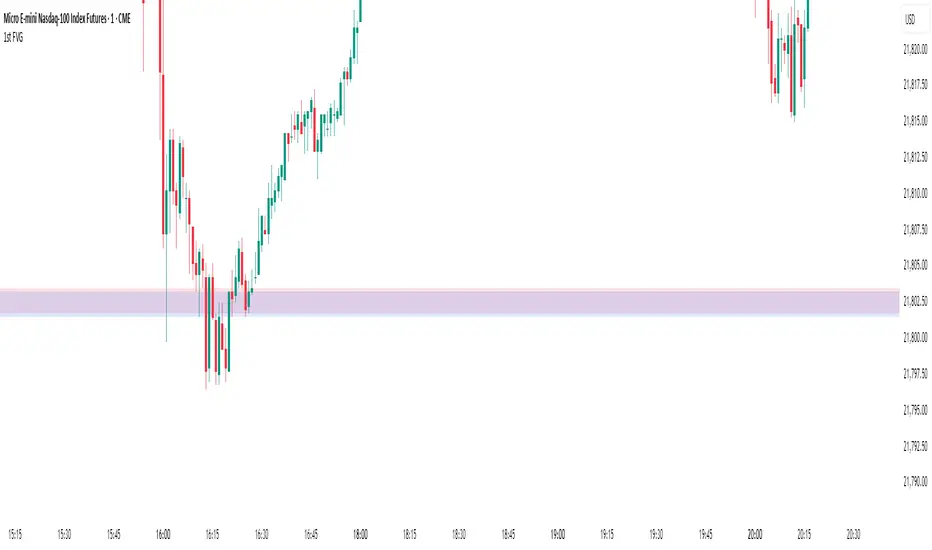
This indicator is specifically designed for intraday price action traders who focus on the NASDAQ opening range. Its primary function is to automatically identify, plot, and alert on the very first Fair Value Gap (FVG) that forms during the critical 30-minute window of the New York morning session, from 9:30 AM to 10:00 AM ET.
The script intelligently ignores any gaps that rely on pre-market data, ensuring that the detected FVG is a true imbalance created by the initial volume and volatility of the regular trading session. This tool helps traders to quickly pinpoint a key area of interest right after the market opens.
Key Features
First FVG Detection: Pinpoints only the initial FVG of the session and ignores all subsequent ones for the day.
Specific Time Window: Operates strictly between 9:30 and 10:00 AM New York time.
Strict Formation Rule: To ensure accuracy, the entire 3-bar FVG pattern must form at or after the 9:30 AM candle. This prevents false signals from pre-market price action.
Visual Price Zones: Automatically draws a clean, colored box around the FVG, making the zone easy to see. The box can be extended to track future price interactions.
Customizable Display: Control how many historical FVGs to show on your chart and how far the zone extends to the right.
Built-in Alerts: Get real-time notifications the moment the first FVG is confirmed, so you never miss a potential setup.
How It Works
The indicator scans the price action candle by candle. Once the 9:30 AM ET session begins, it looks for the first valid 3-bar FVG pattern (also known as a price imbalance).
A Bullish FVG is identified when the low of the current candle is higher than the high of the candle two periods ago.
A Bearish FVG is identified when the high of the current candle is lower than the low of the candle two periods ago.
Once the first FVG for the day is detected and plotted, the script will remain dormant until the next trading day begins, keeping your chart clean and focused.
Settings
Number of FVG History: Controls how many of the most recent daily FVGs are displayed on the chart.
Extend Box To End: A checkbox to extend the FVG zone all the way to the right edge of the chart. This is useful for tracking how price interacts with the zone later in the day.
Manual Box Length: If the "Extend Box" option is unchecked, this input sets a fixed length for the box (in number of bars).
How to Set Up Alerts
Add the indicator to your chart.
Click the 'Alert' icon (alarm clock) in the TradingView toolbar.
In the 'Condition' dropdown menu, select "1st FVG".
A second dropdown will appear, which should be set to "Alert Function Call".
Choose your preferred notification options (e.g., pop-up, email, app notification).
Click 'Create'.
Disclaimer: This indicator is a tool for technical analysis and should not be considered as financial advice. Always use proper risk management and conduct your own research before making any trading decisions.
Note di rilascio
OverviewThis indicator is a powerful and versatile tool designed for intraday traders who want to capitalize on the initial volatility of the New York session. It automatically identifies, plots, and alerts on the very first Fair Value Gap (FVG) that forms during the critical 9:30 AM to 10:00 AM ET time window.
The key feature of this indicator is its adaptive timeframe logic. Whether you are on a 1-minute, 5-minute, or 15-minute chart, it intelligently analyzes the bars of your current timeframe to find the first true imbalance after the market opens, providing clean and relevant signals for your specific trading style.
Key Features
Adaptive Timeframe Analysis: Automatically works on any timeframe. It analyzes 1-minute bars on a 1m chart, 5-minute bars on a 5m chart, and so on.
First FVG Detection: Pinpoints only the initial FVG of the session and ignores all subsequent ones for the day, keeping your chart focused on the most significant early-session imbalance.
Strict Formation Rule: An FVG is only considered valid if all three of its constituent bars form after the 9:30 AM open, ensuring signals are based purely on regular session data.
Dynamic Visuals: Draws clean FVG zones that automatically extend to the right edge of the chart. To maintain a clean workspace, corresponding labels are dynamically "stuck" to the far right of the screen, always visible as you scroll.
Full Customization: Tailor the indicator to your needs by controlling how many historical FVGs are displayed, the box extension behavior, and the vertical distance of the labels.
Real-Time Alerts: A built-in alert function notifies you the moment a new "First FVG" is confirmed, ensuring you never miss a potential setup.
How It Works
The script activates at 9:30 AM ET and begins analyzing the candles on your active timeframe. It searches for the first 3-bar FVG pattern where a price gap exists between the first and third candles. The dynamic labels are anchored to the far-right edge of your screen to ensure they are always visible and never clutter the price action area.
Settings
Number of FVG History: Controls how many of the most recent daily FVG zones are displayed on the chart.
Extend Box To End: A checkbox to automatically extend the FVG zone to the right edge of the chart.
Manual Box Length: Sets a fixed length (in bars) for the box if the "Extend Box" option is unchecked.
Label Vertical Offset (ticks): Controls the vertical gap between an FVG zone and its label, measured in the instrument's minimum price ticks.
How to Set Up Alerts
Add the indicator to your chart.
Click the 'Alert' icon (alarm clock) on the TradingView toolbar.
For 'Condition', select "1st FVG (Adaptive)".
The next dropdown should be set to "Alert Function Call".
Choose your notification preferences (e.g., pop-up, email) and click 'Create'.
Disclaimer: This tool is for technical analysis purposes only and should not be considered financial advice. Always use proper risk management and your own judgment when trading.
Script protetto
Questo script è pubblicato come codice protetto. Tuttavia, è possibile utilizzarle liberamente e senza alcuna limitazione – ulteriori informazioni qui.
Declinazione di responsabilità
Le informazioni e le pubblicazioni non sono intese come, e non costituiscono, consulenza o raccomandazioni finanziarie, di investimento, di trading o di altro tipo fornite o approvate da TradingView. Per ulteriori informazioni, consultare i Termini di utilizzo.