OPEN-SOURCE SCRIPT
Aggiornato Fed Net Liquidity Indicator
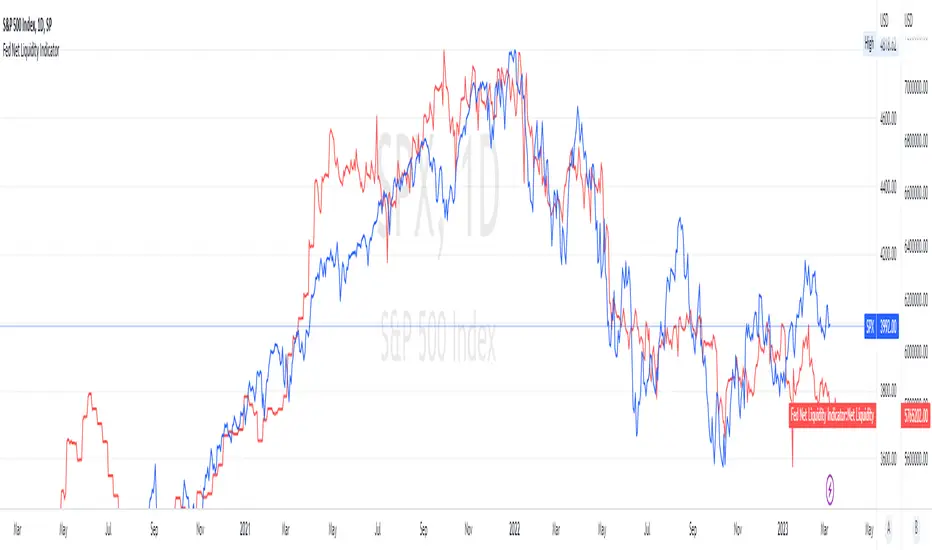
This indicator aims to present a "Net Liquidity" indicator comprised of the Fed Balance sheet , less the TGA account and Overnight Reverse REPO agreements.
Net Liquidity = Fed Balance Sheet - ( TGA + Reverse REPO)
This is an overlay that can be added to stock or other charts (like SPY ) to see how the market may appear correlated to Net Liquidity - injection of liquidity into the markets.
This was hypothesized by Max Anderson, this is just a script realizing that posting.
New updates include a resolution feature, and an option to offset backwards by 2 days per original intent.
Note di rilascio
I have updated the script to fix the units that got changed from the FRED website and imported into TV.I have also updated the script to display the correct units when selecting trillions, billions, and millions.
Note di rilascio
I updated the liquidity indicator to show the Fed Net Liquidity as a line as opposed to a histogram, this fixes the issue with having to scale the background. Should work MUCH better now!!Script open-source
In pieno spirito TradingView, il creatore di questo script lo ha reso open-source, in modo che i trader possano esaminarlo e verificarne la funzionalità. Complimenti all'autore! Sebbene sia possibile utilizzarlo gratuitamente, ricorda che la ripubblicazione del codice è soggetta al nostro Regolamento.
Declinazione di responsabilità
Le informazioni ed i contenuti pubblicati non costituiscono in alcun modo una sollecitazione ad investire o ad operare nei mercati finanziari. Non sono inoltre fornite o supportate da TradingView. Maggiori dettagli nelle Condizioni d'uso.
Script open-source
In pieno spirito TradingView, il creatore di questo script lo ha reso open-source, in modo che i trader possano esaminarlo e verificarne la funzionalità. Complimenti all'autore! Sebbene sia possibile utilizzarlo gratuitamente, ricorda che la ripubblicazione del codice è soggetta al nostro Regolamento.
Declinazione di responsabilità
Le informazioni ed i contenuti pubblicati non costituiscono in alcun modo una sollecitazione ad investire o ad operare nei mercati finanziari. Non sono inoltre fornite o supportate da TradingView. Maggiori dettagli nelle Condizioni d'uso.