OPEN-SOURCE SCRIPT
Connors RSI Test
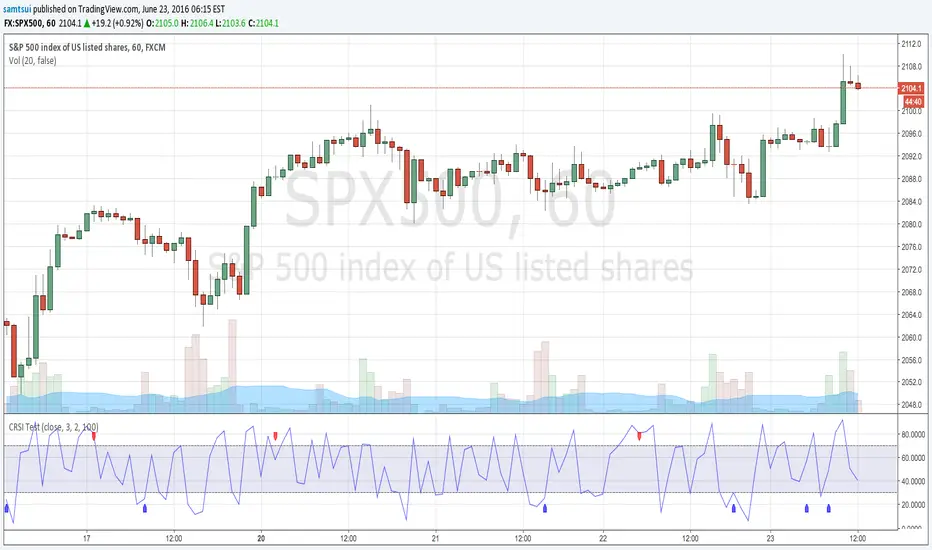
Re Fade2Black request:
The indicator needs to use Connors RSI on candle stick charts.
It basically needs to give an alert if the candle stick closes even or up but the Conors RSI closes down more than 3 points.
Here's a pic showing..
tinypic.com/r/2j62z5v/9
And on the flip side I also need it to give an alert if the candle closes even or down but the conors rsi close up more than 3 points.
Like this..
tinypic.com/r/imjod4/9
I hope I've explained myself well. Let me know how much you'd charge for this.
Thanks
Script open-source
In pieno spirito TradingView, il creatore di questo script lo ha reso open-source, in modo che i trader possano esaminarlo e verificarne la funzionalità. Complimenti all'autore! Sebbene sia possibile utilizzarlo gratuitamente, ricorda che la ripubblicazione del codice è soggetta al nostro Regolamento.
Declinazione di responsabilità
Le informazioni ed i contenuti pubblicati non costituiscono in alcun modo una sollecitazione ad investire o ad operare nei mercati finanziari. Non sono inoltre fornite o supportate da TradingView. Maggiori dettagli nelle Condizioni d'uso.