PROTECTED SOURCE SCRIPT
MTF Trend Analyzer with Swing Pivots & S/R Levels [SmartFoxy]
Indicator “Multi-Timeframe Trend Analyzer with Swing Pivots & S/R Levels”
📌 Overview
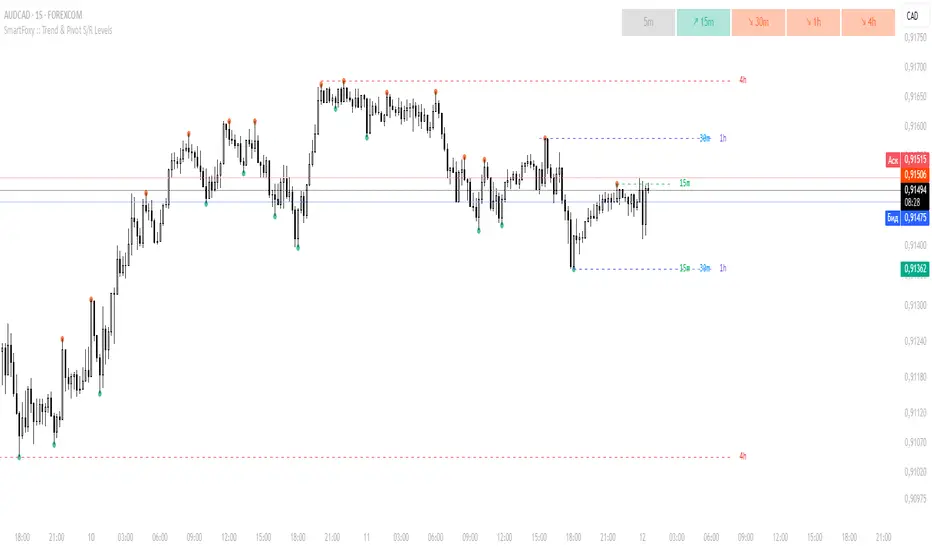
Trend & Pivot S/R Levels is a multi-timeframe market structure analyzer that identifies trend direction, detects swing highs/lows, and plots higher-timeframe support/resistance levels directly on your chart.
Designed for traders who want fast, clean, and accurate trend context without constantly switching timeframes.
________________________________________________________________________________
✨ Core Features
1. Multi-Timeframe Trend Analyzer.
Analyze up to five higher timeframes simultaneously — for example:
5m, 1H, 4H, 1D, 1W, etc.
For each timeframe, the indicator detects:
a) Trend direction:
b) Breakouts of recent pivot highs/lows to determine trend shifts.
c) Automatic graying-out of timeframes lower than the current chart TF.
d) A clean visual Trend Panel that shows:
________________________________________________________________________________
2. Swing Pivot Detection (Current TF)
The script detects local swing points using customizable lookback parameters:
a) Pivot Type:
b) Left/Right Bars Lookback — the number of bars required on both sides to validate the pivot.
c) Multiple marker styles:
This makes it easy to visually confirm that your swing settings are correct.
________________________________________________________________________________
3. Higher-Timeframe Support/Resistance
The indicator automatically draws HTF S/R lines based on the latest pivot highs/lows from each selected timeframe.
Each timeframe has:
This allows you to see major market structure levels from higher timeframes without switching charts.
________________________________________________________________________________
4. Smart Timeframe Safety Checks
If a selected timeframe is lower than your current chart timeframe, its data is:
________________________________________________________________________________
⚙️ Customization Options:
________________________________________________________________________________
✅ Benefits:
________________________________________________________________________________
⚠️ Note
The indicator only displays S/R and trend data from higher timeframes relative to the current chart timeframe.
📌 Overview
Trend & Pivot S/R Levels is a multi-timeframe market structure analyzer that identifies trend direction, detects swing highs/lows, and plots higher-timeframe support/resistance levels directly on your chart.
Designed for traders who want fast, clean, and accurate trend context without constantly switching timeframes.
________________________________________________________________________________
✨ Core Features
1. Multi-Timeframe Trend Analyzer.
Analyze up to five higher timeframes simultaneously — for example:
5m, 1H, 4H, 1D, 1W, etc.
For each timeframe, the indicator detects:
a) Trend direction:
- 🡕 Uptrend;
- 🡖 Downtrend.
b) Breakouts of recent pivot highs/lows to determine trend shifts.
c) Automatic graying-out of timeframes lower than the current chart TF.
d) A clean visual Trend Panel that shows:
- Arrow direction;
- Timeframe label (1D, 1W, etc.);
- Trend color (bullish, bearish, neutral).
________________________________________________________________________________
2. Swing Pivot Detection (Current TF)
The script detects local swing points using customizable lookback parameters:
a) Pivot Type:
- High/Low — classic swing structure;
- Close — smoother swing detection using closing prices.
b) Left/Right Bars Lookback — the number of bars required on both sides to validate the pivot.
c) Multiple marker styles:
- Built-in plot shapes (circle, cross, histogram, etc.);
- Custom visual labels (▲▼, ◉, ✖, 🡇🡅, ◆, ◼, etc.).
This makes it easy to visually confirm that your swing settings are correct.
________________________________________________________________________________
3. Higher-Timeframe Support/Resistance
The indicator automatically draws HTF S/R lines based on the latest pivot highs/lows from each selected timeframe.
Each timeframe has:
- Separate Support / Resistance colors;
- Adjustable line width;
- Selectable line style (solid, dashed, dotted, arrows);
- Optional HTF labels displayed on the lines.
This allows you to see major market structure levels from higher timeframes without switching charts.
________________________________________________________________________________
4. Smart Timeframe Safety Checks
If a selected timeframe is lower than your current chart timeframe, its data is:
- Disabled for S/R plotting;
- Shown in gray inside the Trend Panel;
- Prevents invalid S/R calculations and ensures stable chart performance.
________________________________________________________________________________
⚙️ Customization Options:
- Show/Hide the Trend Panel;
- Panel placement anywhere on the chart;
- Swing pivot type: High/Low or Close;
- Pivot lookback (left/right bars);
- Choose five HTFs to analyze;
- Enable/Disable HTF S/R;
- Configure S/R color for each timeframe;
- Line style + line width;
- Pivot marker type + size;
- Custom label styles + text scaling.
________________________________________________________________________________
✅ Benefits:
- Perfect for traders who need instant multi-timeframe structure awareness;
- Reduces the need to constantly switch charts;
- Works on all markets: crypto, stocks, forex, indices, futures;
- Clean, modern, and intuitive visualization;
- Helps confirm trend direction and key S/R levels at a glance.
________________________________________________________________________________
⚠️ Note
The indicator only displays S/R and trend data from higher timeframes relative to the current chart timeframe.
Script protetto
Questo script è pubblicato come codice protetto. Tuttavia, è possibile utilizzarle liberamente e senza alcuna limitazione – ulteriori informazioni qui.
Declinazione di responsabilità
Le informazioni e le pubblicazioni non sono intese come, e non costituiscono, consulenza o raccomandazioni finanziarie, di investimento, di trading o di altro tipo fornite o approvate da TradingView. Per ulteriori informazioni, consultare i Termini di utilizzo.