OPEN-SOURCE SCRIPT
Aggiornato Minervini Trend Template (EMA)
📄 Description:
This script is inspired by Mark Minervini’s SEPA (Specific Entry Point Analysis) strategy and adapts his famous Trend Template using Exponential Moving Averages (EMAs). It helps traders visually identify technically strong stocks that are in ideal buy conditions based on Minervini's rules.
📈 Strategy Logic:
This script scans for momentum breakouts by filtering stocks with the following characteristics:
✅ Buy Criteria (All Conditions Must Be Met):
Price above 50-day EMA
Price above 150-day EMA
Price above 200-day EMA
50-day EMA above 150-day EMA
150-day EMA above 200-day EMA
200-day EMA trending upward (greater than it was 20 days ago)
Price within 25% of its 52-week high
Price at least 30% above its 52-week low
If all 8 conditions are satisfied, the script triggers a SEPA Setup Signal. This is visually indicated by:
✅ A green background on the chart
✅ A label saying “SEPA Setup” under the bar
🛒 When to Buy:
Wait for the stock to break out above a recent base or consolidation pattern (like a cup-with-handle or flat base) on strong volume.
The ideal entry is within 5% of the breakout point.
Confirm that the SEPA conditions are met on the breakout day.
📉 When to Sell:
Place a stop-loss 5–8% below your entry price.
Exit if the breakout fails and price falls back below the pivot or the 50-day EMA.
Take partial profits after a 20–25% gain, and move your stop-loss up to breakeven or trail it using moving averages like the 21 or 50 EMA.
Exit fully if price closes below the 50-day or 150-day EMA on volume.
🧠 Why EMAs?
EMAs react faster to recent price action than SMAs, helping you catch earlier signals in fast-moving markets. This makes it especially useful for growth and momentum traders following Minervini’s high-performance approach.
📊 How to Use:
Apply the script to any stock chart (daily timeframe recommended).
Look for a green background + SEPA Setup label.
Combine with price/volume analysis, base patterns, and market context to time your entries.
🚨 Optional Alerts:
You can set an alert on the condition minerviniPass == true to notify you when a SEPA-compliant setup appears.
📚 This tool is meant for educational and research purposes. Always validate with your own due diligence and consult your risk plan before making any trades.
Note di rilascio
Feature Benefit📈 Entry Breakout Helps time actual buy based on recent high breakout
🛑 Stop-Loss Line Suggests max acceptable loss, aiding in disciplined risk management
🎯 Profit Target Line First target for trimming profits or moving stop to breakeven
⚖️ RR Overlay Label Shows real-time Reward-to-Risk ratio (e.g., 1:3) for trade evaluation
🔔 Alert Support Set alerts for breakout + SEPA-qualified stocks
Note di rilascio
This script implements Mark Minervini’s SEPA (Specific Entry Point Analysis) strategy using his Trend Template. It combines trend confirmation (via EMAs and 52-week range checks) with breakout-based entries, clear risk-reward levels, exit signals, and built-in alerts.✅ Key Features:
📈 Entry Signals (BUY):
Triggered when:
Price is above EMA 50, 150, and 200
EMA 50 > EMA 150 > EMA 200 (bullish alignment)
EMA 200 is rising (long-term uptrend confirmation)
Price is ≥75% of the 52-week high and ≥30% above the 52-week low
Breakout above 20-bar closing high
A valid breakout with all criteria met will show a BUY label on the chart.
🚪 Exit Signals (SELL):
Triggered when:
Price falls below a predefined stop-loss % (default: 7%)
Price hits the profit target (default: 25%)
Price closes below EMA 50 (trend weakening)
Exit points are marked and can send alerts.
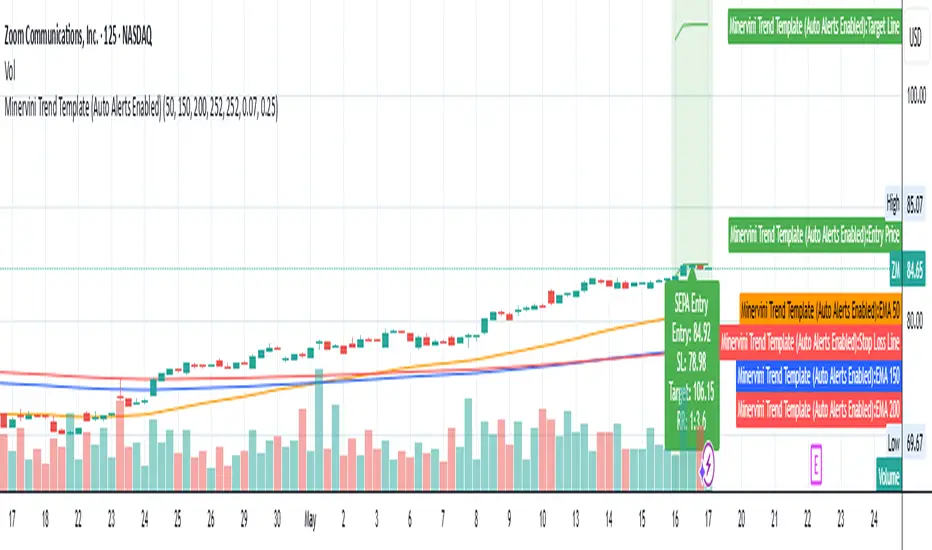
📊 Risk-Reward Visualization:
Automatically calculates and plots:
Entry price
Stop-loss line
Target line
Risk-to-reward ratio
🔔 Built-In Alerts:
Receive instant alerts when:
A SEPA entry is triggered
Stop-loss or target is reached
Price closes below EMA 50
Alerts work with TradingView’s built-in notification options (app, email, browser popup).
⚙️ Custom Inputs:
EMA lengths
Risk/Reward percentages
Breakout and lookback periods
⚠️ Disclaimer:
This script is shared strictly for educational purposes.
I am not a licensed financial advisor or trading professional.
The signals provided by this script are not investment advice and do not guarantee profitable outcomes.
Always perform your own analysis and consult with a qualified financial professional before making trading decisions.
Script open-source
Nello spirito di TradingView, l'autore di questo script lo ha reso open source, in modo che i trader possano esaminarne e verificarne la funzionalità. Complimenti all'autore! Sebbene sia possibile utilizzarlo gratuitamente, ricordiamo che la ripubblicazione del codice è soggetta al nostro Regolamento.
Declinazione di responsabilità
Le informazioni e le pubblicazioni non sono intese come, e non costituiscono, consulenza o raccomandazioni finanziarie, di investimento, di trading o di altro tipo fornite o approvate da TradingView. Per ulteriori informazioni, consultare i Termini di utilizzo.