OPEN-SOURCE SCRIPT
Volatility Price Range
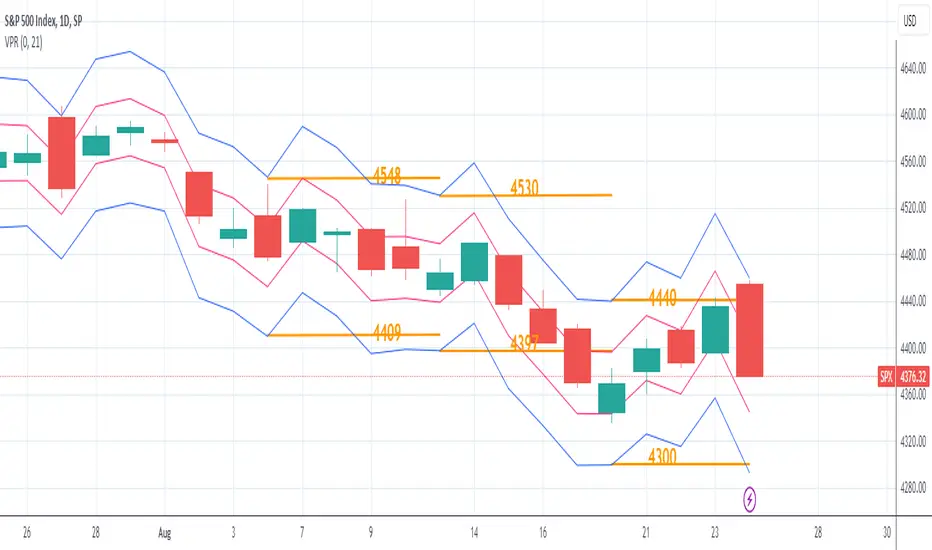
The Volatility Price Range is an overlay which estimates a price range for the next seven days and next day, based on historical volatility (already available in TradingView). The upper and lower bands are calculated as follows:
The Volatility for one week is calculated using the formula: WV = HV * √t where:
WV: one-week volatility
HV: annual volatility
√: square root
t: the time factor expressed in years
From this formula we can deduce the weekly volatility WV = HV * √(1 / 52) = HV / 7.2 where 52: weeks in a year.
The daily volatility DV = HV * √(1 / 365) = HV / 19.1 where 365: days in a year.
To calculate the lower and upper value of the bands, the weekly/daily volatility value obtained will be subtracted/added from/to the current price.
Script open-source
In pieno spirito TradingView, il creatore di questo script lo ha reso open-source, in modo che i trader possano esaminarlo e verificarne la funzionalità. Complimenti all'autore! Sebbene sia possibile utilizzarlo gratuitamente, ricorda che la ripubblicazione del codice è soggetta al nostro Regolamento.
Declinazione di responsabilità
Le informazioni ed i contenuti pubblicati non costituiscono in alcun modo una sollecitazione ad investire o ad operare nei mercati finanziari. Non sono inoltre fornite o supportate da TradingView. Maggiori dettagli nelle Condizioni d'uso.