PROTECTED SOURCE SCRIPT
Realtime Order Bubbles — cryptomonk
Description:
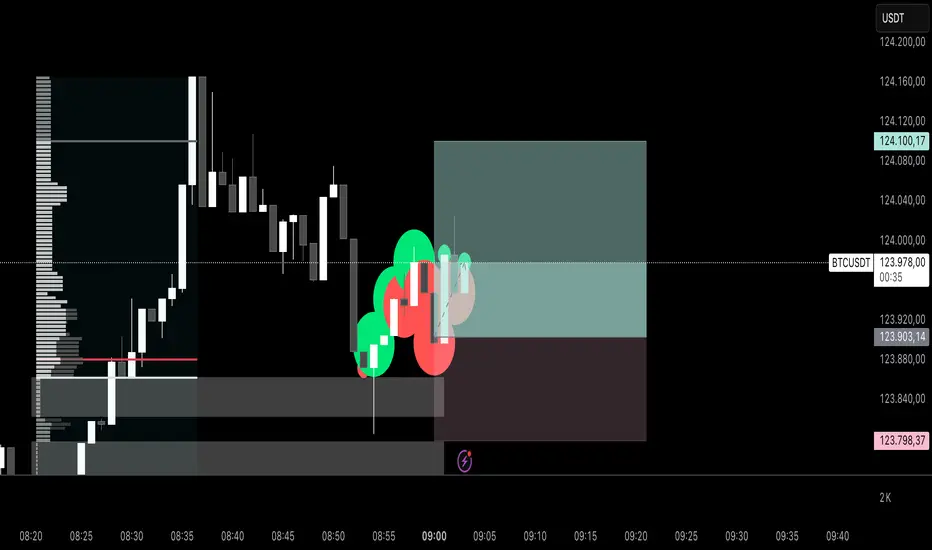
Displays real-time bubbles on the chart to visualize buy and sell activity within each candle.
• Green bubbles → Volume increase on upticks (buy pressure)
• Red bubbles → Volume increase on downticks (sell pressure)
• Bubble size → Strength of the volume change
How it works:
The indicator compares live tick updates (or bar closes) against previous volume and price values to detect whether a move was initiated by buyers or sellers, then plots bubbles in real-time accordingly.
Best used for:
• Scalping / Intraday analysis on lower timeframes (1–5 min)
• Detecting volume spikes, momentum shifts, and aggressive order flow
• Works best when chart is set to “Go Live” for tick-level updates
Use case:
A lightweight visual tool for identifying short-term order flow and understanding market pressure without needing full footprint data.
Script protetto
Questo script è pubblicato come codice protetto. Tuttavia, è possibile utilizzarle liberamente e senza alcuna limitazione – ulteriori informazioni qui.
Declinazione di responsabilità
Le informazioni e le pubblicazioni non sono intese come, e non costituiscono, consulenza o raccomandazioni finanziarie, di investimento, di trading o di altro tipo fornite o approvate da TradingView. Per ulteriori informazioni, consultare i Termini di utilizzo.