OPEN-SOURCE SCRIPT
Accumulation Swing Index
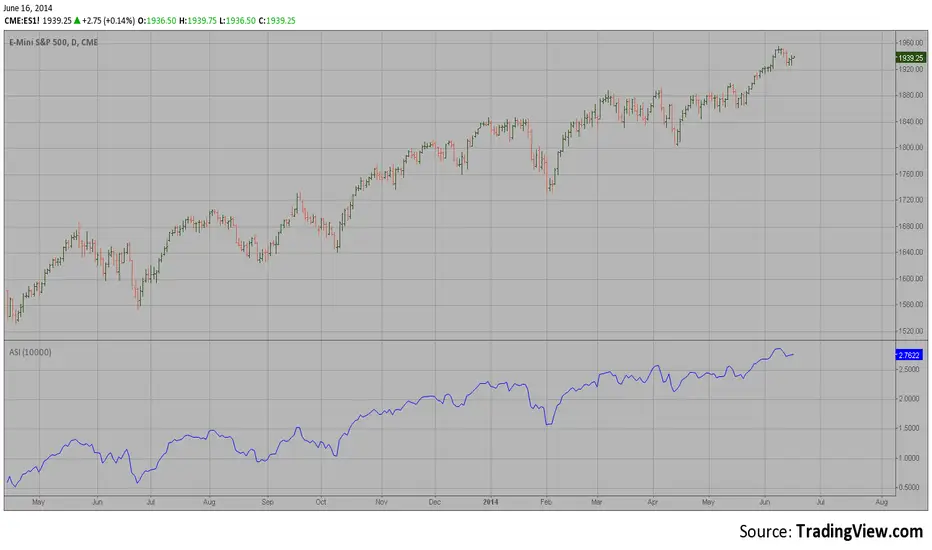
The Accumulation Swing Index is a cumulative total of the Swing Index.
The Accumulation Swing Index was developed by Welles Wilder.
The SwingIndex function was developed to help cut through the maze of
Open, High, Low and Close prices to indicate the real strength and direction
of the market. The Swing Index function looks at the Open, High, Low and
Close values for a two-bar period. The theory is that there are four cross-bar
and one intra-bar comparisons that are strong indicators of an up or down day.
The Swing Index returns a number between -100 and 100. If the factors point toward
an up day, then the function value will be positive and vice versa. In this way,
the Swing Index gives us definite short-term swing points, and it can be used to
supplement other methods as a breakout indicator. A breakout is indicated when the
value of the Accumulation Swing Index (ASI) exceeds the ASI value on the day when a
previous significant High Swing Point was made. A downside breakout is indicated when
the value of the ASI drops below the ASI value on a day when a previous significant
low swing point was made.
Since only futures have a relative daily limit value, this function only makes sense
when applied to a futures contract. If you use this function and it only plots a zero
flat line, check the Daily Limit value.
Script open-source
In pieno spirito TradingView, il creatore di questo script lo ha reso open-source, in modo che i trader possano esaminarlo e verificarne la funzionalità. Complimenti all'autore! Sebbene sia possibile utilizzarlo gratuitamente, ricorda che la ripubblicazione del codice è soggetta al nostro Regolamento.
Declinazione di responsabilità
Le informazioni ed i contenuti pubblicati non costituiscono in alcun modo una sollecitazione ad investire o ad operare nei mercati finanziari. Non sono inoltre fornite o supportate da TradingView. Maggiori dettagli nelle Condizioni d'uso.