[VIP] ABCD Pattern
The AB=CD pattern is one of the most popular harmonic chart patterns.
Buy and sell signals are generated after the final C-to-D leg, when a reversal is expected to occur.
If the pattern is trending higher, you can look to sell or enter a short position at Point D.
If the pattern is trending lower, you can look to buy the security at Point D in anticipation of a turnaround.
Stop-loss points are best placed just above or below Point D, depending on the direction of the trade.
If the move extends beyond that point, the chart pattern is invalidated and the reversal is less likely to occur.
Take-profit points are typically placed using Fibonacci levels.
For example, you might look for a move back to the original Point A and move a trailing stop-loss to 28.2%, 50% and 61.8% Fibonacci levels along the way.
The AB=CD chart pattern works best when combined with other technical indicators or chart patterns, such as the relative strength index (RSI) or pivot points.
You may also want to use volume as a confirmation of a reversal once the AB=CD chart pattern makes a prediction.
CONFIGURATION
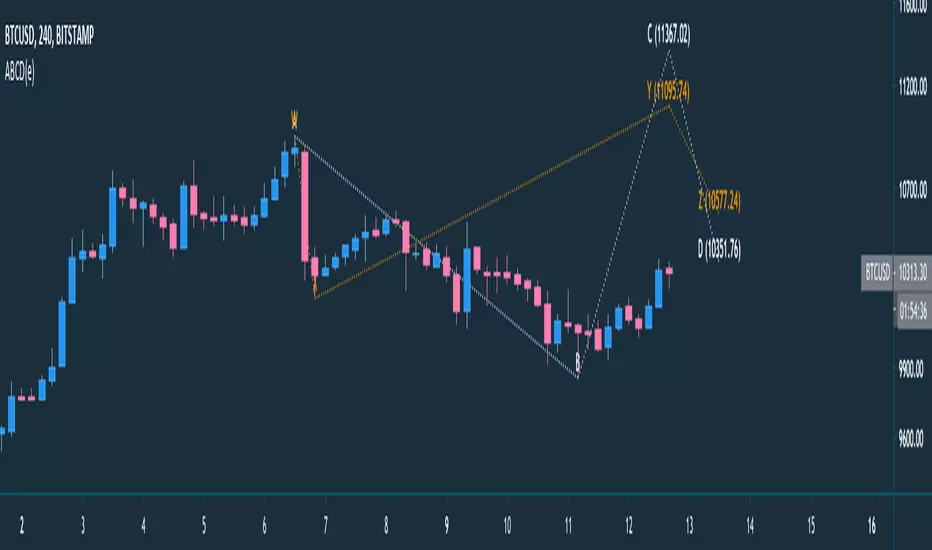
- Strategy ABCD :
- AB=CD : Leg AB is equal to leg CD
- Ratio : Formula to get leg CD by (AB/0.618) x 1.272 but if
- Forecast : is the continuity of ratio abcd, it is called ABCDE - Different between ABCD vs WXYZ, ABCD is harmonic pattern based on latest chart, but WXYZ based on previous preiodic
- Label style : Balloon will show with comment box, but Text just a simple character without comment shape
- Line style : default is dotted, available values are dashed, solid and dotted
- Colour : change line colour for line and text
- Show label : Display or hide label
Please check link below for but report, trial and join with community
Fixed line CD issue on forecast
Fixed monthly chart issue
Script su invito
Solo gli utenti approvati dall'autore possono accedere a questo script. È necessario richiedere e ottenere l'autorizzazione per utilizzarlo. Tale autorizzazione viene solitamente concessa dopo il pagamento. Per ulteriori dettagli, seguire le istruzioni dell'autore riportate di seguito o contattare direttamente deSultanTM.
TradingView NON consiglia di acquistare o utilizzare uno script a meno che non si abbia piena fiducia nel suo autore e se ne comprenda il funzionamento. È inoltre possibile trovare alternative gratuite e open source nei nostri script della community.
Istruzioni dell'autore
Declinazione di responsabilità
Script su invito
Solo gli utenti approvati dall'autore possono accedere a questo script. È necessario richiedere e ottenere l'autorizzazione per utilizzarlo. Tale autorizzazione viene solitamente concessa dopo il pagamento. Per ulteriori dettagli, seguire le istruzioni dell'autore riportate di seguito o contattare direttamente deSultanTM.
TradingView NON consiglia di acquistare o utilizzare uno script a meno che non si abbia piena fiducia nel suo autore e se ne comprenda il funzionamento. È inoltre possibile trovare alternative gratuite e open source nei nostri script della community.