PROTECTED SOURCE SCRIPT
Aggiornato ICT HTF Candles + CISD + FVG, by Alephxxii
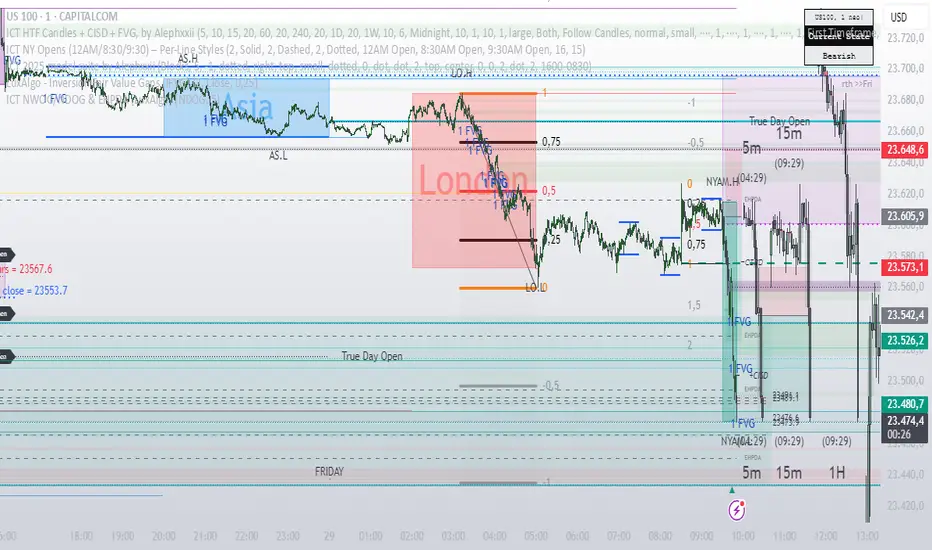
ICT HTF Candles + CISD + FVG
A practical, friendly overlay for ICT-style trading
This indicator gives you three things at once—right on your chart:
HTF Candles Panel (context):
Compact candles from higher timeframes (e.g., 5m, 15m, 1H, 4H, 1D, 1W) appear to the right of price so you always see the higher-timeframe story without switching charts. It includes labels, remaining time for the current HTF candle, and optional open/high/low/close reference lines.
CISD Levels (bias flips):
Automatically plots +CISD and -CISD lines. When price closes above +CISD, the indicator considers bullish delivery. When price closes below -CISD, it considers bearish delivery. An on-chart table (optional) shows the current bias at a glance.
FVG (Fair Value Gaps):
Highlights inefficiency zones (gaps) on your current timeframe and/or a selected higher timeframe. You can choose to mark a gap “filled” when price hits the midpoint (optional).
Quick start (2 minutes)
Add to chart and keep your normal trading timeframe (e.g., 1–5m).
In settings → HTF 1..6, pick the higher timeframes you want to see (e.g., 5m, 15m, 1H, 4H, 1D, 1W).
Turn on FVG (current, HTF or both).
Watch +CISD / -CISD lines and the Current State table.
Close above +CISD → Bullish bias
Close below -CISD → Bearish bias
Trade with the bias and use FVGs as areas to refine entries or targets.
How to read it (the simple way)
Bias (CISD):
Bullish once price closes above the active +CISD level.
Bearish once price closes below the active -CISD level.
The small table (if enabled) says Bullish or Bearish right now.
HTF panel:
Shows higher-timeframe candles next to your current chart.
Labels show the timeframe (e.g., 1H) and a countdown for the current candle.
Optional traces draw HTF Open/High/Low/Close levels—great “magnets” for price.
FVGs:
Shaded boxes = potential inefficiency areas.
If Midpoint Fill is on, a touch of the midline counts as filled.
You can display current TF, HTF, or both.
Suggested workflow (popular ICT-style intraday)
Define bias with CISD
Only look for longs if Bullish, shorts if Bearish.
Check HTF context
Are you trading into a large HTF FVG or key HTF O/H/L/C level? That can be a target or a headwind.
Refine entries with FVGs
On your entry TF (1–5m), use fresh FVGs in the direction of the bias. Avoid fading straight into big HTF imbalances.
Key settings you’ll actually use
HTF 1..6: toggle each strip, select timeframe, and how many candles to show.
Style & layout: adjust offset, spacing, and width of the right-side panels.
Labels & timers: show/hide HTF name and remaining time; place labels at Top/Bottom/Both.
Custom daily open (NY): set the 1D candle to start at Midnight, 08:30, or 09:30 (America/New_York).
Trace lines: optional HTF O/H/L/C lines (style, width, anchor TF).
FVG module (extra): choose Current TF / HTF / Both, enable Midpoint Fill, auto-delete on fill, and show timeframe labels.
CISD lines: customize color, style (solid/dotted/dashed), thickness, and forward extension.
Table: enable/disable and choose its position.
Alerts
When a CISD completes, the script fires an alert (e.g., “Bullish CISD Formed” or “Bearish CISD Formed”).
Tip: Set your TradingView alert once on the indicator, then choose the alert message you want to receive.
Notes & limitations (read me)
“VI” label: The “Volume Imbalance” option marks price imbalances (body non-overlap). It does not read volume data.
Timezone: Daily logic and timers use America/New_York, which aligns with US indices/equities and common ICT practice.
Performance: This tool draws many boxes/lines/labels. If your chart feels heavy, reduce the number of HTFs or candles shown, or narrow panel width.
Repainting: HTF panels are designed to avoid future leakage; FVG logic follows standard 3-bar checks. As usual, wait for candle closes for confirmations.
Level cleanup: If Keep old CISD levels is OFF (default), the script keeps only the current active CISD to reduce clutter.
Note di rilascio
Sessions addedScript protetto
Questo script è pubblicato come codice protetto. Tuttavia, è possibile utilizzarle liberamente e senza alcuna limitazione – ulteriori informazioni qui.
Declinazione di responsabilità
Le informazioni e le pubblicazioni non sono intese come, e non costituiscono, consulenza o raccomandazioni finanziarie, di investimento, di trading o di altro tipo fornite o approvate da TradingView. Per ulteriori informazioni, consultare i Termini di utilizzo.
Script protetto
Questo script è pubblicato come codice protetto. Tuttavia, è possibile utilizzarle liberamente e senza alcuna limitazione – ulteriori informazioni qui.
Declinazione di responsabilità
Le informazioni e le pubblicazioni non sono intese come, e non costituiscono, consulenza o raccomandazioni finanziarie, di investimento, di trading o di altro tipo fornite o approvate da TradingView. Per ulteriori informazioni, consultare i Termini di utilizzo.