OPEN-SOURCE SCRIPT
MACD Divergence Strategy
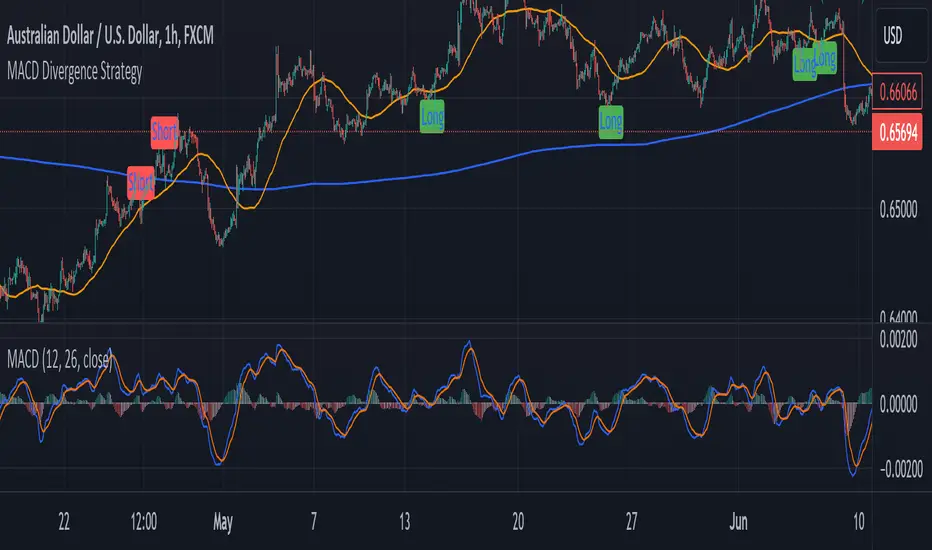
Strategy Description: MACD Divergence with SMA Crossover Strategy
Overview:
The MACD Divergence with SMA Crossover Strategy is designed to identify high-probability trading opportunities based on the interaction of the MACD (Moving Average Convergence Divergence) indicator and key moving averages. This strategy focuses on detecting divergences between the MACD line and the signal line, combined with specific conditions related to the 50-period and 800-period SMAs. It ensures that the MACD and signal lines do not cross the zero line between the current and previous divergence points, thereby filtering out weaker signals and enhancing the accuracy of trade entries.
Key Components:
Simple Moving Averages (SMAs):
50-period SMA: A short-term trend indicator that helps identify the prevailing market direction.
800-period SMA: A long-term trend indicator used to gauge the overall market trend.
MACD Indicator:
MACD Line: Represents the difference between the 12-period EMA and the 26-period EMA.
Signal Line: A 9-period EMA of the MACD line.
Histogram: The difference between the MACD line and the signal line, used to visualize the strength of the signal.
Trade Conditions:
Long Position (Buy):
The 50 SMA is above the 800 SMA, indicating a bullish market trend.
The MACD line and signal line are both below zero, signifying a potential bullish reversal.
A bullish divergence is detected when the MACD line crosses above the signal line below zero, without either line crossing the zero level between the current and previous cross.
Short Position (Sell):
The 50 SMA is below the 800 SMA, indicating a bearish market trend.
The MACD line and signal line are both above zero, signaling a potential bearish reversal.
A bearish divergence is detected when the MACD line crosses below the signal line above zero, without either line crossing the zero level between the current and previous cross.
Signal Plotting:
Long Signals: Displayed when the conditions for a bullish divergence and SMA alignment are met, marked with a green upward arrow on the chart.
Short Signals: Displayed when the conditions for a bearish divergence and SMA alignment are met, marked with a red downward arrow on the chart.
Script open-source
Nello spirito di TradingView, l'autore di questo script lo ha reso open source, in modo che i trader possano esaminarne e verificarne la funzionalità. Complimenti all'autore! Sebbene sia possibile utilizzarlo gratuitamente, ricordiamo che la ripubblicazione del codice è soggetta al nostro Regolamento.
Declinazione di responsabilità
Le informazioni e le pubblicazioni non sono intese come, e non costituiscono, consulenza o raccomandazioni finanziarie, di investimento, di trading o di altro tipo fornite o approvate da TradingView. Per ulteriori informazioni, consultare i Termini di utilizzo.