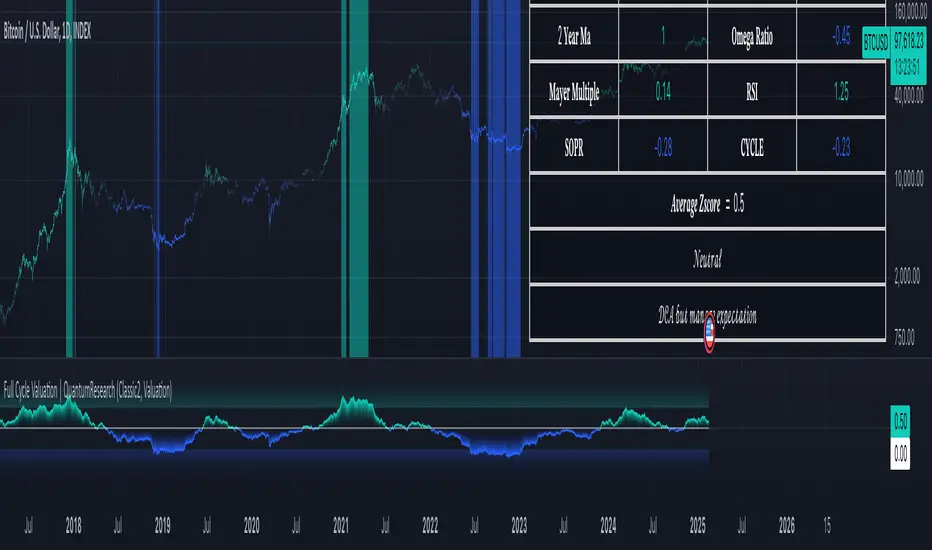
Full Cycle Valuation | QuantumResearch
The Full Cycle Valuation indicator is an advanced on-chain valuation model that synthesizes multiple fundamental Bitcoin metrics into a single, normalized score.
By leveraging Power Law Corridor, Pi Cycle Top, Crosby Ratio, MVRV Z-Score, SOPR Z-Score, NUPL Z-Score, BAERM, and other key valuation signals, this tool provides traders and investors with an intuitive way to assess Bitcoin’s market cycle positioning and identify potential overbought or undervalued conditions. 🚀📊
1. Overview
This indicator helps users:
Identify Market Cycles – Uses a blend of statistical and fundamental models to determine whether Bitcoin is undervalued or overvalued.🔄
Normalize On-Chain & Valuation Metrics – Standardizes multiple valuation indicators through Z-score transformation for clearer insights📉📈
Assess Risk & Reward – Generates an Average Valuation Z-score, offering a high-level overview of current market positioning. ⚖️
Customize Visual Preferences – Dynamic color-coded signals, background fills, and table-based valuation metrics enhance usability. 🎨
2. How It Works
A. Power Law Corridor
The Power Law Model provides a long-term price corridor for Bitcoin based on a logarithmic regression formula. 🔢
The indicator evaluates where the current price sits relative to the Power Law Support & Resistance levels. 📊
Normalized Z-score Calculation: A standardized metric indicating overvaluation or undervaluation. 🎯
B. Pi Cycle Top
Uses the 111-day and 350-day moving averages to identify cyclical market peaks. 🔺
Generates a Z-score that measures deviation from historical overbought conditions. ⚠️
C. Crosby Ratio
Measures market momentum by analyzing Heikin-Ashi candle trends and ATR-based volatility. 📊
Provides a weekly trend strength score that is normalized into a Z-score. 📈
D. MVRV Z-Score
Compares Bitcoin's Market Cap to Realized Cap to assess whether price is above or below fair value. 💰
The higher the MVRV Z-score, the more overvalued Bitcoin is; lower scores indicate undervaluation. 🔻
E. SOPR Z-Score
Spent Output Profit Ratio (SOPR) measures profit-taking behavior in the market. 💵
SOPR is smoothed and standardized to filter out noise and highlight macro trends. 📊
F. NUPL Z-Score
Net Unrealized Profit/Loss (NUPL) calculates the proportion of coins held in profit versus loss. 📉📈
High Z-score values indicate speculative euphoria, while low values suggest capitulation. ⚠️
G. BAERM (Bitcoin AR Model)
BAERM is a statistical model that incorporates Bitcoin's supply, halvings, and historical growth trends to estimate fair value. 📉
This model is adjusted with a damping function to remove excess noise. 🎛️
H. Composite Full Cycle Z-Score
The indicator calculates a weighted average Z-score across all valuation models to generate a final Full Cycle Valuation Score. 📊
The score is used to define five distinct market states:
Very Undervalued (-3 to -2 Z-score): Ideal accumulation zone. 🟢
Undervalued (-2 to -1.5 Z-score): Accumulate Bitcoin at a discount. 🔵
Neutral (-1.5 to +1.5 Z-score): Fair market conditions. ⚪
Overheated (+1.5 to +2 Z-score): Potential distribution phase. 🟠
Very Overheated (>2 Z-score): High risk of market tops. 🔴
3. Visual Representation
This indicator offers multiple dynamic visual elements to improve clarity and ease of use:
Color-Coded Background Fill
Green Background – Indicates undervalued market conditions (Accumulation). 🟢
Blue Background – Signals overheated conditions (Distribution). 🔵
Table Display for Z-Scores
Displays each individual valuation model’s Z-score in a compact, color-coded format. 📊
The final average Z-score is highlighted, along with a corresponding market action recommendation. 🎯
4. Customization & Parameters
Traders and analysts can fine-tune the Full Cycle Valuation indicator to match their specific strategies:
On-Chain Valuation Metrics MVRV, SOPR, and NUPL Z-score lengths can be adjusted for different market perspectives.
Market Cycle Models Power Law Corridor: Adjustable regression parameters to modify long-term projections.
Pi Cycle & Crosby Ratio: Customizable smoothing lengths.
Threshold Adjustments Modify overvaluation and undervaluation thresholds to fine-tune signal sensitivity.
Visual Settings
Valuation Mode: Allows traders to switch between default mode and valuation-focused color themes. 🎨
5. Trading Applications
This indicator is not just for trading—it serves as a powerful macro analysis tool:
Long-Term Investing – Helps Bitcoin investors identify key accumulation and distribution phases. 📈
Market Timing – Guides traders in recognizing overbought and oversold conditions based on fundamental valuation. ⏳
Risk Management – Provides a systematic way to assess whether Bitcoin is fundamentally cheap or expensive. ⚠️
Cyclical Trend Analysis – Helps long-term investors compare past market cycles and spot repeating patterns. 🔄
6. Final Thoughts
The Full Cycle Valuation Indicator is a comprehensive macro valuation tool that combines multiple on-chain, statistical, and fundamental models into one easy-to-interpret score.
Whether you are a long-term investor looking to time Bitcoin cycles or a trader searching for additional confluence, this tool offers invaluable insights.
Important Disclaimer: No indicator can predict future price action with certainty. Always perform additional research and use proper risk management when making investment decisions. ⚠️📊
Script su invito
Solo gli utenti approvati dall'autore possono accedere a questo script. È necessario richiedere e ottenere l'autorizzazione per utilizzarlo. Tale autorizzazione viene solitamente concessa dopo il pagamento. Per ulteriori dettagli, seguire le istruzioni dell'autore riportate di seguito o contattare direttamente QuantumResearch.
TradingView NON consiglia di acquistare o utilizzare uno script a meno che non si abbia piena fiducia nel suo autore e se ne comprenda il funzionamento. È inoltre possibile trovare alternative gratuite e open source nei nostri script della community.
Istruzioni dell'autore
whop.com/quantum-whop/
⚒️ Get access to our toolbox here for free:
quantumresearchportfolio.carrd.co
All tools and content provided are for informational and educational purposes only.
Declinazione di responsabilità
Script su invito
Solo gli utenti approvati dall'autore possono accedere a questo script. È necessario richiedere e ottenere l'autorizzazione per utilizzarlo. Tale autorizzazione viene solitamente concessa dopo il pagamento. Per ulteriori dettagli, seguire le istruzioni dell'autore riportate di seguito o contattare direttamente QuantumResearch.
TradingView NON consiglia di acquistare o utilizzare uno script a meno che non si abbia piena fiducia nel suo autore e se ne comprenda il funzionamento. È inoltre possibile trovare alternative gratuite e open source nei nostri script della community.
Istruzioni dell'autore
whop.com/quantum-whop/
⚒️ Get access to our toolbox here for free:
quantumresearchportfolio.carrd.co
All tools and content provided are for informational and educational purposes only.