PROTECTED SOURCE SCRIPT
Aggiornato FNO Straddle/Strangle Premium Tracker
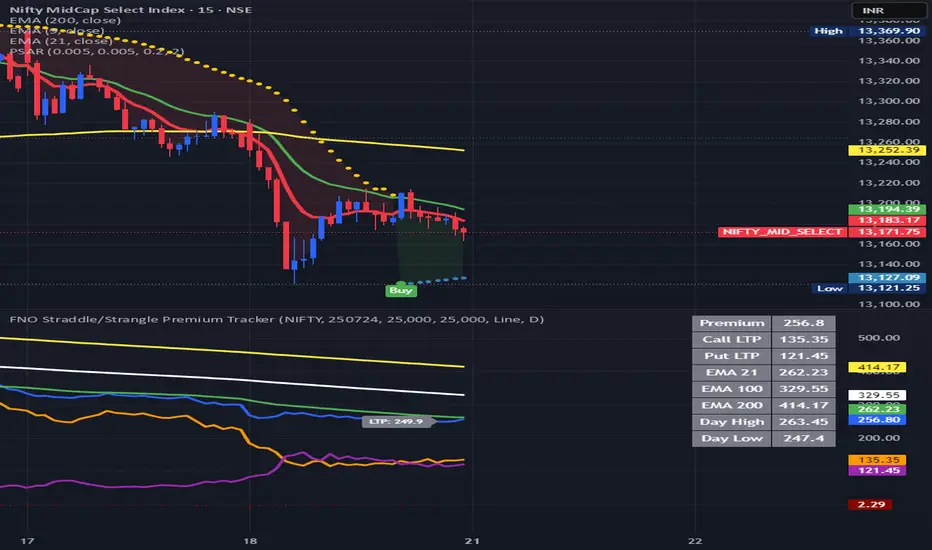
The FNO Straddle/Strangle Premium Tracker is a powerful Pine Script indicator designed for options traders to monitor the combined premium of a straddle or strangle strategy for Indian F&O instruments. It tracks the sum of call and put option prices, visualizes the premium as a candlestick or line chart, and includes technical indicators like EMAs and premium percentage change. The indicator also provides a real-time data table, alerts for key events, and exportable data for analysis, making it ideal for tracking premium movements and identifying trading opportunities.
Key Features
Customizable Inputs: Select from a wide range of underlying symbols (e.g., NIFTY, BANKNIFTY, stocks like RELIANCE, TCS), expiry date, call/put strike prices, chart type (Candlestick or Line), and timeframe (1-min to Daily).
Premium Visualization: Plots the combined premium (Call + Put) as a candlestick or line chart, with customizable colors for easy trend identification.
Exponential Moving Averages (EMAs): Displays 21, 100, and 200-period EMAs to track premium trends, with alerts for premium crossing above/below the 21-period EMA.
Premium % Change: Shows the percentage change in the combined premium as a histogram for quick momentum analysis.
Real-Time Data Table: A table in the top-right corner displays the latest premium, call/put Last Traded Prices (LTP), and EMA values (21, 100, 200).
Error Handling: Alerts users with a warning label if the selected symbol, expiry, or strike is invalid or data is unavailable.
Data Export: Outputs the latest premium, call LTP, and put LTP as a text string for easy copying or analysis.
LTP Label: Displays the current premium value every 5 bars for quick reference.
How It Works
Input Selection: Choose the underlying symbol, expiry date (YYMMDD format, e.g., 250626 for June 26, 2025), call and put strike prices, chart type, and timeframe.
Data Fetching: The script fetches real-time OHLC (Open, High, Low, Close) data for the selected call and put options using the specified symbol and expiry.
Premium Calculation: Combines the call and put option prices to calculate the straddle/strangle premium (Open, High, Low, Close).
Visualization: Plots the premium as a candlestick (green for bullish, red for bearish) or a blue line chart, along with EMAs, call/put LTP lines, and a premium % change histogram.
Alerts & Notifications: Triggers alerts when the premium crosses the 21-period EMA and displays a warning if data is invalid.
Data Display: Shows key metrics in a table and provides exportable data for further analysis.
Inputs
Select Symbol: Choose the underlying instrument (e.g., NIFTY, BANKNIFTY, RELIANCE, etc.).
Expiry Date: Enter the option expiry in YYMMDD format (e.g., 250626).
Call/Put Strike: Specify the strike prices for the call and put options.
Chart Type: Select "Candlestick" or "Line" to visualize the premium.
Timeframe: Choose the data aggregation period (e.g., 1-min, 5-min, Daily).
Outputs
Chart: Candlestick or line plot of the combined premium, with EMAs (21, 100, 200), call/put LTP, and premium % change histogram.
Table: Real-time display of premium, call/put LTP, and EMA values.
Alerts: Notifications for premium crossing EMA21 or invalid data.
Export Data: A text string with the latest premium, call LTP, and put LTP for external use.
Use Cases
Straddle/Strangle Trading: Monitor premium movements for at-the-money (ATM) straddles or out-of-the-money (OTM) strangles to time entries/exits.
Trend Analysis: Use EMAs to identify bullish or bearish trends in the premium.
Momentum Trading: Leverage the premium % change histogram to spot rapid price movements.
Risk Management: Track call and put LTP individually to assess option price behavior.
Data Analysis: Export premium data for backtesting or strategy development.
How to Use
Add the indicator to your TradingView chart.
Configure the inputs (symbol, expiry, strikes, chart type, timeframe) based on your trading setup.
Monitor the chart for premium trends, EMA crossovers, and % change signals.
Use the table and export data for real-time insights or external analysis.
Set up alerts to get notified when the premium crosses the 21-period EMA.
Notes
Ensure the symbol, expiry, and strike prices are valid for your data provider to avoid "Invalid Symbol" errors.
The indicator works best on Indian F&O instruments (NSE/BSE) with active options chains.
For optimal performance, use shorter timeframes (e.g., 1-min, 5-min) for intraday trading or Daily for positional analysis.
The premium % change histogram helps identify volatility spikes, useful for breakout strategies.
Limitations
Requires valid option chain data from TradingView’s data provider.
Performance may vary on low-liquidity instruments or illiquid strike prices.
Alerts are limited to EMA21 crossovers; additional custom alerts can be added as needed.
Feedback
If you have suggestions or need additional features (e.g., Bollinger Bands, RSI, or volatility metrics), feel free to comment! Happy trading!
Note di rilascio
updatedNote di rilascio
Updated the table with day high & low for the combine premium.Script protetto
Questo script è pubblicato come codice protetto. Tuttavia, è possibile utilizzarle liberamente e senza alcuna limitazione – ulteriori informazioni qui.
Declinazione di responsabilità
Le informazioni e le pubblicazioni non sono intese come, e non costituiscono, consulenza o raccomandazioni finanziarie, di investimento, di trading o di altro tipo fornite o approvate da TradingView. Per ulteriori informazioni, consultare i Termini di utilizzo.
Script protetto
Questo script è pubblicato come codice protetto. Tuttavia, è possibile utilizzarle liberamente e senza alcuna limitazione – ulteriori informazioni qui.
Declinazione di responsabilità
Le informazioni e le pubblicazioni non sono intese come, e non costituiscono, consulenza o raccomandazioni finanziarie, di investimento, di trading o di altro tipo fornite o approvate da TradingView. Per ulteriori informazioni, consultare i Termini di utilizzo.