OPEN-SOURCE SCRIPT
Volume Spike Analysis [marketsurvivalist]
This indicator is based on the ideas about Volume Spike Analysis written about by Vincent Kott in his book Volume Spike Analysis. Formulas are presented in the book for another platform, but I wrote the script based on the charts he provided.
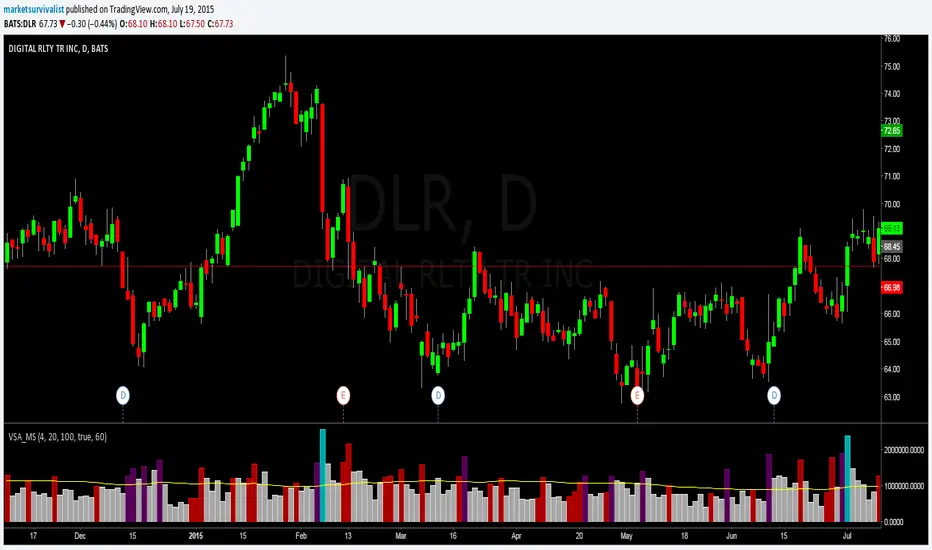
The indicator basically takes out the noise and colors bars based on factors of time and volume for day. There are three different time periods you can set: Short, Medium, Long. Each period can be set with a different color. The period value looks for highest volume bar within that period. If today's volume bar is the hightest value, it colors the volume bar based on the formatted color. It does not matter if the price bar is up or down. The defaults are 4 days, 20 days, 100 days. There is also a volume moving average available to show or hide based on you trading style.
The purpose is to easily see changes in volume. Typically, you would like to see volume rising as a new trend begins. This will show up quickly as you will see a cluster of rising red and / or purple bars.
Script open-source
In pieno spirito TradingView, il creatore di questo script lo ha reso open-source, in modo che i trader possano esaminarlo e verificarne la funzionalità. Complimenti all'autore! Sebbene sia possibile utilizzarlo gratuitamente, ricorda che la ripubblicazione del codice è soggetta al nostro Regolamento.
Declinazione di responsabilità
Le informazioni ed i contenuti pubblicati non costituiscono in alcun modo una sollecitazione ad investire o ad operare nei mercati finanziari. Non sono inoltre fornite o supportate da TradingView. Maggiori dettagli nelle Condizioni d'uso.