OPEN-SOURCE SCRIPT
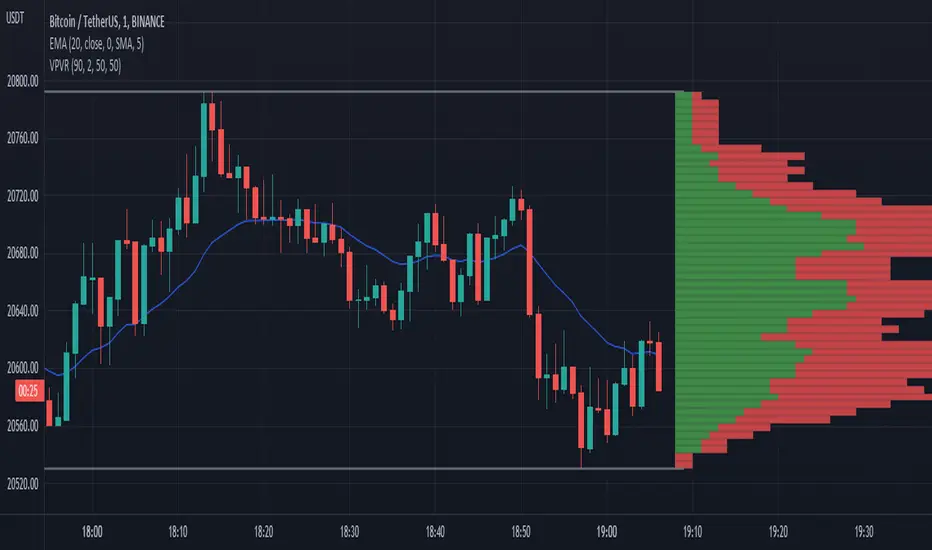
Aggiornato Fr3d0's Volume Profile Visible Range
Low level implementation
At the core of VPVR there’s a concept called “bucketization”.
Question: what is bucketization?
Answer: bucketization consists of identifying metrics with high predictive power and combine them appropriately.
I think this is a problem of bucketization because what the VPVR does is to take a price range, divide it into buckets and fill them up with the volume that was produced in each bucket’s range over the given period.
The more we divide our price range the finer the resolution, but also the less significant each bucket will become.
The steps are:
1. Get the price range with min and max over the give period;
2. Divide the range into buckets;
3. Loop over each candle of the given period and proportionally assign volume to one or more bucket.
Question: how to assign volume to buckets?
Answer: we need to calculate the right amount to add to each bucket for each candle. If 20% of a candle lies on a bucket then that bucket needs to have 20% of the volume of that candle, the rest 80% belongs to other buckets.
To get the percentage of a candle on a given bucket we have to find the price range of the candle contained within the bucket, then divide that amount by the entire length of the candle.
How to bucketize
Question: what are the formulas of A, B, C and Target respectively?
Answer:
- A = Max(candle_high, bucket_top) - Min(candle_low, bucket_bottom);
- B = Max(candle_high, bucket_top) - Min(candle_high, bucket_top);
- C = Max(candle_low, bucket_bottom) - Min(candle_low, bucket_bottom);
- Target = A - B - C.
Now that we now how to calculate the price range belonging to each bucket we need to calculate a percentage of volume to fill the bucket with.
The formula is trivially simple:
Volume * Target / (candle_high - candle_low).
Question: can we distinguish between buy volume and sell volume? If so, how?
Answer: yes we can and the following paragraph will teach you how.
Put it simply we can use the difference between the extremes of a candle (low and high) and its close price to get the buy and sell volumes.
The formulas for that are:
- Buy volume = Volume * (close - low) / (high - low);
- Sell volume = Volume * (high - close) / (high - low).
I know this is rather simplicistic but it makes sense.
Closing thoughts
This script is a working progress and I’m going to give more details if necessary, just let me know in the comments down below.
Note di rilascio
Add distance from last candle as requested by TradingView's usersNote di rilascio
Fix last added featureNote di rilascio
Clean up the drawings on every tick, so there's only one instance of the indicator at any given momentNote di rilascio
Add color inputs, now the user can customize colors for lines and barsScript open-source
In pieno spirito TradingView, il creatore di questo script lo ha reso open-source, in modo che i trader possano esaminarlo e verificarne la funzionalità. Complimenti all'autore! Sebbene sia possibile utilizzarlo gratuitamente, ricorda che la ripubblicazione del codice è soggetta al nostro Regolamento.
Declinazione di responsabilità
Le informazioni ed i contenuti pubblicati non costituiscono in alcun modo una sollecitazione ad investire o ad operare nei mercati finanziari. Non sono inoltre fornite o supportate da TradingView. Maggiori dettagli nelle Condizioni d'uso.
Script open-source
In pieno spirito TradingView, il creatore di questo script lo ha reso open-source, in modo che i trader possano esaminarlo e verificarne la funzionalità. Complimenti all'autore! Sebbene sia possibile utilizzarlo gratuitamente, ricorda che la ripubblicazione del codice è soggetta al nostro Regolamento.
Declinazione di responsabilità
Le informazioni ed i contenuti pubblicati non costituiscono in alcun modo una sollecitazione ad investire o ad operare nei mercati finanziari. Non sono inoltre fornite o supportate da TradingView. Maggiori dettagli nelle Condizioni d'uso.