PROTECTED SOURCE SCRIPT
Dynamic Support & Resistance Zones
This indicator dynamically detects and plots support and resistance levels by analyzing recent price pivots. It works as follows:
Inputs:
Set the number of bars to look back, pivot strength (left/right), minimum touches for a major level, and a tolerance percentage that is converted to decimal.
Note:
• Pivot Left is the number of bars before the candidate bar that must be lower (for a swing high) or higher (for a swing low) than the candidate. It ensures the candidate is higher (or lower) than recent previous bars.
• Pivot Right is the number of bars after the candidate bar that are also required to be lower (for a swing high) or higher (for a swing low) than the candidate. This parameter is crucial because it verifies that the candidate bar wasn’t just a temporary spike—price needs to remain below (or above) the candidate for a number of subsequent bars.
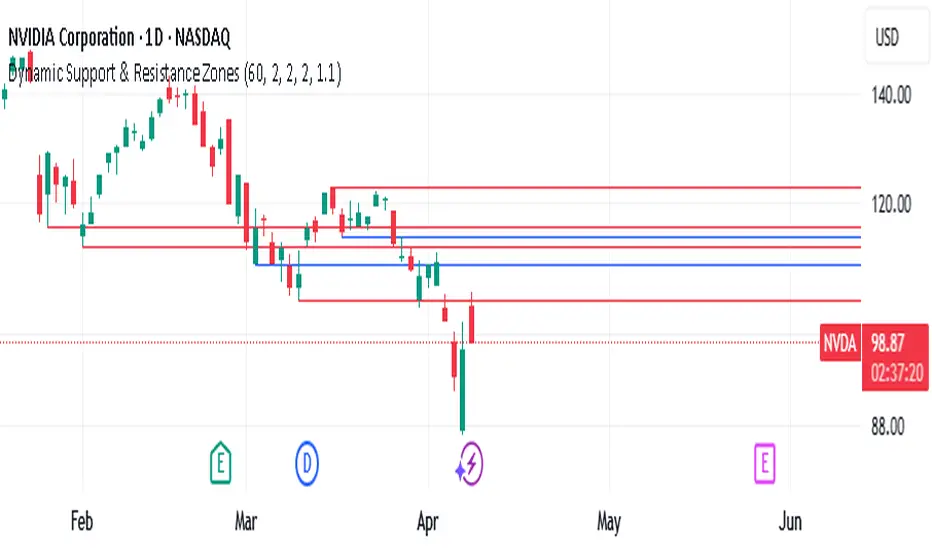
Suggested default settings for a daily chart: Bars to Look Back: 60; Pivot Left: 2; Pivot Right: 2; Min Touches for Major Level: 2; Tolerance (%): 1
Pivot Detection:
It uses built-in pivot functions to identify swing highs (potential resistance) and swing lows (potential support) based on a user-defined lookback window and pivot strength.
Clustering:
Detected levels that are close (within a set tolerance) are grouped into clusters. Each cluster averages the levels and counts the number of touches. This helps determine if a zone is repeatedly tested.
Visual Display:
It plots horizontal lines on the chart:
Red lines indicate “major” zones that have been tested a number of times (as defined by the user).
Blue lines represent secondary levels that have been touched less often.
Dynamic Cleanup:
Clusters outside the user-defined lookback period are removed so that only recent, relevant levels remain visible.
In short, the indicator creates a dynamic, visually updated map of key support and resistance zones based on recent price action and pivot behavior.
Inputs:
Set the number of bars to look back, pivot strength (left/right), minimum touches for a major level, and a tolerance percentage that is converted to decimal.
Note:
• Pivot Left is the number of bars before the candidate bar that must be lower (for a swing high) or higher (for a swing low) than the candidate. It ensures the candidate is higher (or lower) than recent previous bars.
• Pivot Right is the number of bars after the candidate bar that are also required to be lower (for a swing high) or higher (for a swing low) than the candidate. This parameter is crucial because it verifies that the candidate bar wasn’t just a temporary spike—price needs to remain below (or above) the candidate for a number of subsequent bars.
Suggested default settings for a daily chart: Bars to Look Back: 60; Pivot Left: 2; Pivot Right: 2; Min Touches for Major Level: 2; Tolerance (%): 1
Pivot Detection:
It uses built-in pivot functions to identify swing highs (potential resistance) and swing lows (potential support) based on a user-defined lookback window and pivot strength.
Clustering:
Detected levels that are close (within a set tolerance) are grouped into clusters. Each cluster averages the levels and counts the number of touches. This helps determine if a zone is repeatedly tested.
Visual Display:
It plots horizontal lines on the chart:
Red lines indicate “major” zones that have been tested a number of times (as defined by the user).
Blue lines represent secondary levels that have been touched less often.
Dynamic Cleanup:
Clusters outside the user-defined lookback period are removed so that only recent, relevant levels remain visible.
In short, the indicator creates a dynamic, visually updated map of key support and resistance zones based on recent price action and pivot behavior.
Script protetto
Questo script è pubblicato come codice protetto. Tuttavia, è possibile utilizzarle liberamente e senza alcuna limitazione – ulteriori informazioni qui.
Declinazione di responsabilità
Le informazioni e le pubblicazioni non sono intese come, e non costituiscono, consulenza o raccomandazioni finanziarie, di investimento, di trading o di altro tipo fornite o approvate da TradingView. Per ulteriori informazioni, consultare i Termini di utilizzo.