PROTECTED SOURCE SCRIPT
VS Dynamic Candle Replicator Pro
The "VS Dynamic Candle Replicator Pro" is a powerful and flexible Pine Script™ indicator designed for traders who want to gain a better understanding of price action by replicating key candle movements across various timeframes. This indicator allows users to project the Open, High, Low, and Close of any candle from a selected timeframe onto the current chart, making it easy to compare candle dynamics, anticipate future price movements, and identify potential reversal or continuation points.
By visually projecting past candles from any timeframe and adjusting their properties such as color, size, and offset, traders can gain unique insights into market conditions. Whether you are a day trader or a swing trader, this tool offers an innovative way to visualize price patterns and make informed decisions.
Indicator Description:
The VS Dynamic Candle Replicator Pro dynamically replicates a selected timeframe's candle and overlays it on your current chart. This enables you to visually monitor how past candle characteristics influence the present market behavior.
This indicator is equipped with two main components:
Dynamic Candle Replicator:
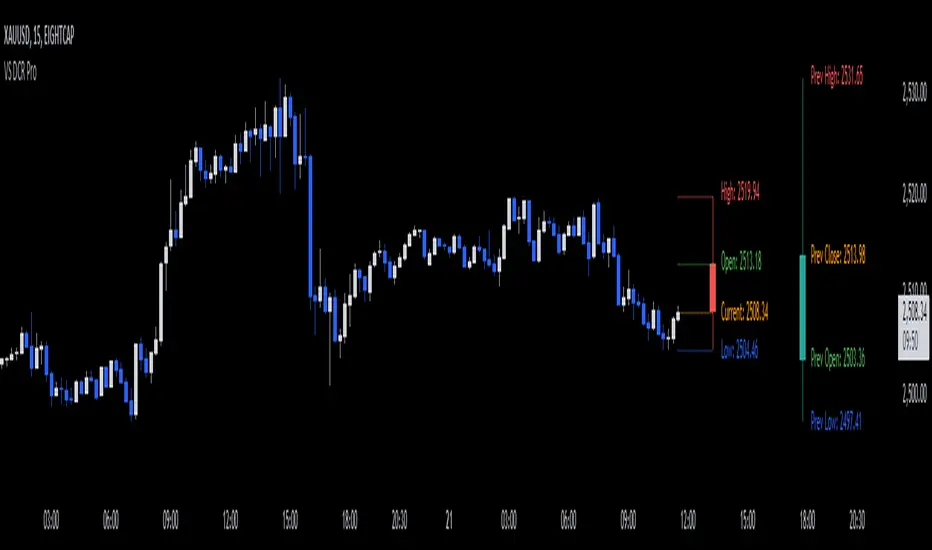
This feature allows users to project a candle from a chosen timeframe onto the current chart. You can choose the candle’s position, appearance, and even toggle the visualization on or off. For example, you can project a daily candle onto a 15-minute chart and compare how intraday movements correspond to the daily range.
Previous Daily Candle Projection:
Users can also choose to display the previous daily candle (or any other timeframe) directly on the chart. This helps to see the momentum carried from the previous day and its impact on today’s price action.
Both of these components feature full customization of candle width, line width, and colors. Additionally, the indicator labels key price levels—Open, High, Low, and Close—so traders can clearly identify critical support and resistance levels.
Features & Settings:
1. Timeframe Selection:
Timeframe: Choose which timeframe’s candle you want to replicate. Options include anything from intraday periods (like 1 minute) to daily, weekly, or even monthly candles. This flexibility allows traders to seamlessly shift between different market perspectives.
2. Candle Offset & Sizing:
Offset (bars to the right): Control how many bars the replicated candle is shifted to the right. This is useful for visual clarity, allowing you to isolate the replicated candle from the current price action.
Candle Width & Line Width: Adjust the visual thickness of the candle body and the wicks for better visibility.
3. Candle Color Customization:
Bullish/Bearish Colors: Choose distinct colors for bullish and bearish candles. This visual cue makes it easier to distinguish market trends at a glance.
4. Projected Levels (Lines & Labels):
Dynamic labels and lines mark the Open, High, Low, and Close levels of the replicated candle. These are also fully customizable in terms of color, line style, and label positioning.
5. Vertical Offset:
Adjust the vertical positioning of labels for the price levels to prevent overlapping and ensure clarity on the chart.
6. Toggle Features:
Show or hide both the dynamic replicator candle and the previous daily candle at any time to declutter the chart when needed.
How to Use the VS Dynamic Candle Replicator Pro:
Select the Desired Timeframe:
Begin by choosing the timeframe for the candle you want to replicate. For example, if you want to observe the behavior of a daily candle on a 5-minute chart, set the timeframe to "1D".
Set the Offset and Size:
Customize the position of the replicated candle by adjusting the "Offset (bars to the right)" input. This ensures the replicated candle does not interfere with the current price action. You can also adjust the size of the candle body and wicks for optimal visibility.
Customize Colors:
Choose your preferred colors for bullish and bearish candles to quickly recognize the market sentiment represented by the replicated candle. This is particularly helpful for distinguishing between periods of upward and downward momentum.
Enable or Disable Features:
You can toggle the display of the dynamic replicator candle and the previous daily candle depending on what you want to focus on. This flexibility is useful for decluttering your chart when you need to focus on specific price patterns.
Observe Key Levels:
The indicator will project lines and labels marking the Open, High, Low, and Close of the selected timeframe candle. These key levels act as crucial support and resistance zones and provide insights into potential price reactions.
Monitor Price Action Around Replicated Candles:
Use the replicated candle as a reference to compare the current price action. This can be a helpful tool in identifying trends, spotting reversals, or confirming price breakouts.
Applications:
Day Trading: Overlay higher timeframe candles (such as daily or 4-hour candles) on shorter timeframes (e.g., 5-minute or 15-minute charts) to better understand the broader context and key levels.
Swing Trading: Visualize how daily or weekly candles align with intraday movements to make more informed decisions on trend continuations or reversals.
Key Level Identification: The projected Open, High, Low, and Close levels serve as important reference points for support and resistance, helping traders execute more precise entries and exits.
Conclusion:
The VS Dynamic Candle Replicator Pro is an innovative tool designed for traders who want to enhance their market analysis by comparing past and present price action in a visually intuitive manner. Its high level of customization and ease of use make it a valuable asset for traders of all experience levels. Whether you are looking to improve your understanding of market dynamics or refine your trading strategy, this indicator provides the necessary tools to gain a clearer perspective on price movements.
Embrace a smarter way of analyzing the market with the VS Dynamic Candle Replicator Pro and take your trading to the next level!
By visually projecting past candles from any timeframe and adjusting their properties such as color, size, and offset, traders can gain unique insights into market conditions. Whether you are a day trader or a swing trader, this tool offers an innovative way to visualize price patterns and make informed decisions.
Indicator Description:
The VS Dynamic Candle Replicator Pro dynamically replicates a selected timeframe's candle and overlays it on your current chart. This enables you to visually monitor how past candle characteristics influence the present market behavior.
This indicator is equipped with two main components:
Dynamic Candle Replicator:
This feature allows users to project a candle from a chosen timeframe onto the current chart. You can choose the candle’s position, appearance, and even toggle the visualization on or off. For example, you can project a daily candle onto a 15-minute chart and compare how intraday movements correspond to the daily range.
Previous Daily Candle Projection:
Users can also choose to display the previous daily candle (or any other timeframe) directly on the chart. This helps to see the momentum carried from the previous day and its impact on today’s price action.
Both of these components feature full customization of candle width, line width, and colors. Additionally, the indicator labels key price levels—Open, High, Low, and Close—so traders can clearly identify critical support and resistance levels.
Features & Settings:
1. Timeframe Selection:
Timeframe: Choose which timeframe’s candle you want to replicate. Options include anything from intraday periods (like 1 minute) to daily, weekly, or even monthly candles. This flexibility allows traders to seamlessly shift between different market perspectives.
2. Candle Offset & Sizing:
Offset (bars to the right): Control how many bars the replicated candle is shifted to the right. This is useful for visual clarity, allowing you to isolate the replicated candle from the current price action.
Candle Width & Line Width: Adjust the visual thickness of the candle body and the wicks for better visibility.
3. Candle Color Customization:
Bullish/Bearish Colors: Choose distinct colors for bullish and bearish candles. This visual cue makes it easier to distinguish market trends at a glance.
4. Projected Levels (Lines & Labels):
Dynamic labels and lines mark the Open, High, Low, and Close levels of the replicated candle. These are also fully customizable in terms of color, line style, and label positioning.
5. Vertical Offset:
Adjust the vertical positioning of labels for the price levels to prevent overlapping and ensure clarity on the chart.
6. Toggle Features:
Show or hide both the dynamic replicator candle and the previous daily candle at any time to declutter the chart when needed.
How to Use the VS Dynamic Candle Replicator Pro:
Select the Desired Timeframe:
Begin by choosing the timeframe for the candle you want to replicate. For example, if you want to observe the behavior of a daily candle on a 5-minute chart, set the timeframe to "1D".
Set the Offset and Size:
Customize the position of the replicated candle by adjusting the "Offset (bars to the right)" input. This ensures the replicated candle does not interfere with the current price action. You can also adjust the size of the candle body and wicks for optimal visibility.
Customize Colors:
Choose your preferred colors for bullish and bearish candles to quickly recognize the market sentiment represented by the replicated candle. This is particularly helpful for distinguishing between periods of upward and downward momentum.
Enable or Disable Features:
You can toggle the display of the dynamic replicator candle and the previous daily candle depending on what you want to focus on. This flexibility is useful for decluttering your chart when you need to focus on specific price patterns.
Observe Key Levels:
The indicator will project lines and labels marking the Open, High, Low, and Close of the selected timeframe candle. These key levels act as crucial support and resistance zones and provide insights into potential price reactions.
Monitor Price Action Around Replicated Candles:
Use the replicated candle as a reference to compare the current price action. This can be a helpful tool in identifying trends, spotting reversals, or confirming price breakouts.
Applications:
Day Trading: Overlay higher timeframe candles (such as daily or 4-hour candles) on shorter timeframes (e.g., 5-minute or 15-minute charts) to better understand the broader context and key levels.
Swing Trading: Visualize how daily or weekly candles align with intraday movements to make more informed decisions on trend continuations or reversals.
Key Level Identification: The projected Open, High, Low, and Close levels serve as important reference points for support and resistance, helping traders execute more precise entries and exits.
Conclusion:
The VS Dynamic Candle Replicator Pro is an innovative tool designed for traders who want to enhance their market analysis by comparing past and present price action in a visually intuitive manner. Its high level of customization and ease of use make it a valuable asset for traders of all experience levels. Whether you are looking to improve your understanding of market dynamics or refine your trading strategy, this indicator provides the necessary tools to gain a clearer perspective on price movements.
Embrace a smarter way of analyzing the market with the VS Dynamic Candle Replicator Pro and take your trading to the next level!
Script protetto
Questo script è pubblicato come codice protetto. Tuttavia, è possibile utilizzarle liberamente e senza alcuna limitazione – ulteriori informazioni qui.
Declinazione di responsabilità
Le informazioni e le pubblicazioni non sono intese come, e non costituiscono, consulenza o raccomandazioni finanziarie, di investimento, di trading o di altro tipo fornite o approvate da TradingView. Per ulteriori informazioni, consultare i Termini di utilizzo.