OPEN-SOURCE SCRIPT
POC Indicator
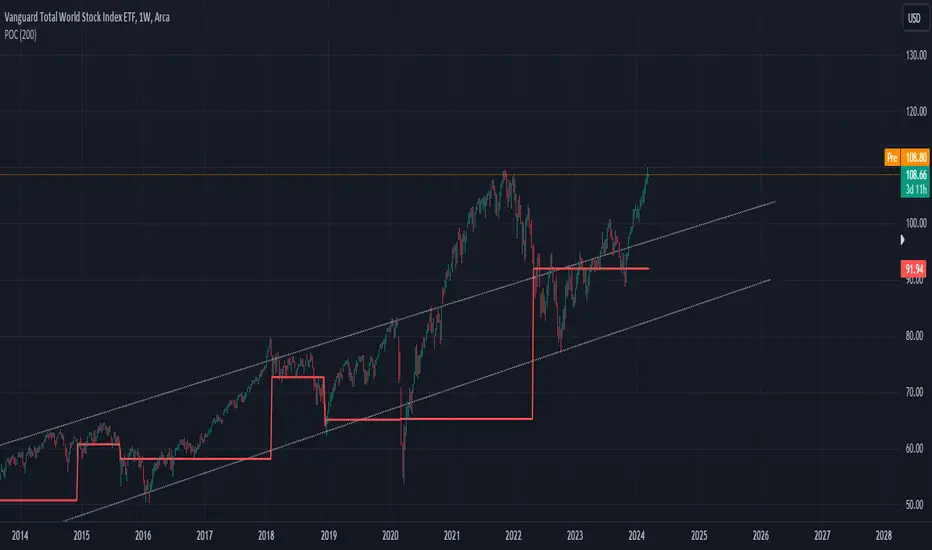
This simplified Point of Control (POC) indicator for TradingView is designed to identify and plot the price level where the highest volume of trading occurred over a specified period. The script works as follows:
Input and Initialization: The user specifies a length for the analysis period. Variables highestVolPrice and highestVol are initialized to track the price with the highest volume and the highest volume encountered, respectively.
Volume Analysis Loop: For each bar in the specified period (up to length bars back from the current bar), the script compares the volume of the current bar (volume) to highestVol. If the current bar's volume is higher, highestVol and highestVolPrice are updated to reflect the volume and closing price of the current bar.
Plotting the POC: Instead of using a horizontal line (hline), which cannot be dynamically updated within the loop, the script uses plot to draw the POC. This plotting function draws a line on the chart that represents the closing price level associated with the highest volume observed within the analysis period.
Resetting Variables: To ensure the indicator updates correctly with each new bar, the script resets highestVol and highestVolPrice at the start of the analysis for each new period. This step is designed to recalculate the POC dynamically as new data comes in.
This approach offers a basic method for visualizing significant price levels where substantial trading activity occurred, potentially indicating areas of strong support or resistance. However, it's a simplified model and does not calculate the true POC based on a detailed volume profile across all price levels within the period.
Script open-source
In pieno spirito TradingView, il creatore di questo script lo ha reso open-source, in modo che i trader possano esaminarlo e verificarne la funzionalità. Complimenti all'autore! Sebbene sia possibile utilizzarlo gratuitamente, ricorda che la ripubblicazione del codice è soggetta al nostro Regolamento.
Declinazione di responsabilità
Le informazioni ed i contenuti pubblicati non costituiscono in alcun modo una sollecitazione ad investire o ad operare nei mercati finanziari. Non sono inoltre fornite o supportate da TradingView. Maggiori dettagli nelle Condizioni d'uso.