PROTECTED SOURCE SCRIPT
Aggiornato Dynamic Momentum Shift Detector [Invesmate]
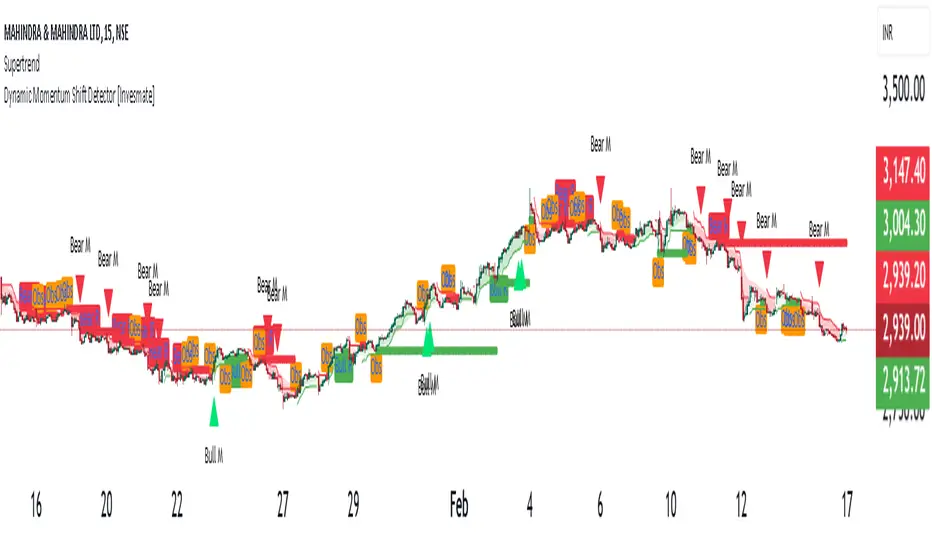
Dynamic Momentum Shift Detector [Invesmate]
Overview
The Dynamic Momentum Shift Detector is an advanced trend-following and momentum-based indicator designed to help traders identify high-probability trading opportunities. It combines RSI-based momentum detection, Supertrend confirmation, and EMA sentiment tracking to provide reliable buy and sell signals.
This indicator is useful for traders who rely on price action and momentum shifts to make informed trading decisions. The goal is to capture early trend reversals while filtering false signals using multiple confirmations.
Key Features & Unique Aspects
*A Supertrend (ATR 20, Factor 2) is used to validate the overall market trend.
*Prevents false breakouts by ensuring buy signals occur above the Supertrend line and sell signals occur below it.
*
21-EMA Sentiment Filter
A 21-period Exponential Moving Average (EMA) acts as a market sentiment indicator.
Background color changes for quick visual cues:
Green Fill: Price is above EMA (bullish sentiment).
Red Fill: Price is below EMA (bearish sentiment).
Refined Buy/Sell Confirmation Criteria
To eliminate weak signals, additional price action conditions are applied:
Buy Confirmation: Higher high, bullish close, and strong candle body (>40% of range).
Sell Confirmation: Lower low, bearish close, and strong candle body (>40% of range).
Persistent Buy/Sell Levels
Displays persistent buy and sell levels (green/red dots) on the chart.
These remain active until invalidated by price action.
Bull & Bear Momentum (RSI-8 for Strong Reversals)
Bull M (Green Triangle): RSI (8) crosses above 72 with a strong bullish candle (>60% body).
Bear M (Red Triangle): RSI (8) crosses below 27 with a strong bearish candle (>60% body).
How to Use the Indicator
Buy Setup:
✅ Look for a green "Bull R" signal when:
RSI crosses above 25.
Price is above Supertrend & EMA 21.
Additional confirmation from bullish candle structure.
Sell Setup:
✅ Look for a red "Bear R" signal when:
RSI crosses below 75.
Price is below Supertrend & EMA 21.
Additional confirmation from bearish candle structure.
Observation Signals:
⚠️ "Obs Buy" (Orange Label) → Possible buy setup, but missing confirmation.
⚠️ "Obs Sell" (Orange Label) → Possible sell setup, but missing confirmation.
Momentum Reversal Markers (Strong Buy/Sell Signals)
🔺 "Bull M" (Green Triangle) → Strong bullish momentum shift detected.
🔻 "Bear M" (Red Triangle) → Strong bearish momentum shift detected.
Why This Indicator is Unique & Valuable
✔ Combines multiple indicators (RSI, Supertrend, EMA) with a structured approach.
✔ Avoids false signals by requiring confirmation from price action.
✔ Provides persistent support/resistance levels to track active trades.
✔ Visually clean and easy to use with minimal chart clutter.
This indicator is suitable for swing traders, intraday traders, and positional traders who want high-probability setups with clear trend direction.
Overview
The Dynamic Momentum Shift Detector is an advanced trend-following and momentum-based indicator designed to help traders identify high-probability trading opportunities. It combines RSI-based momentum detection, Supertrend confirmation, and EMA sentiment tracking to provide reliable buy and sell signals.
This indicator is useful for traders who rely on price action and momentum shifts to make informed trading decisions. The goal is to capture early trend reversals while filtering false signals using multiple confirmations.
Key Features & Unique Aspects
- RSI (2-Period) for Momentum Detection
- Uses an extremely short 2-period RSI to detect overbought (75) and oversold (25) conditions.
- Buy Signal: RSI crosses above 25 and price is above the Supertrend line.
- Sell Signal: RSI crosses below 75 and price is below the Supertrend line.
- Supertrend for Trend Confirmation
*A Supertrend (ATR 20, Factor 2) is used to validate the overall market trend.
*Prevents false breakouts by ensuring buy signals occur above the Supertrend line and sell signals occur below it.
*
21-EMA Sentiment Filter
A 21-period Exponential Moving Average (EMA) acts as a market sentiment indicator.
Background color changes for quick visual cues:
Green Fill: Price is above EMA (bullish sentiment).
Red Fill: Price is below EMA (bearish sentiment).
Refined Buy/Sell Confirmation Criteria
To eliminate weak signals, additional price action conditions are applied:
Buy Confirmation: Higher high, bullish close, and strong candle body (>40% of range).
Sell Confirmation: Lower low, bearish close, and strong candle body (>40% of range).
Persistent Buy/Sell Levels
Displays persistent buy and sell levels (green/red dots) on the chart.
These remain active until invalidated by price action.
Bull & Bear Momentum (RSI-8 for Strong Reversals)
Bull M (Green Triangle): RSI (8) crosses above 72 with a strong bullish candle (>60% body).
Bear M (Red Triangle): RSI (8) crosses below 27 with a strong bearish candle (>60% body).
How to Use the Indicator
Buy Setup:
✅ Look for a green "Bull R" signal when:
RSI crosses above 25.
Price is above Supertrend & EMA 21.
Additional confirmation from bullish candle structure.
Sell Setup:
✅ Look for a red "Bear R" signal when:
RSI crosses below 75.
Price is below Supertrend & EMA 21.
Additional confirmation from bearish candle structure.
Observation Signals:
⚠️ "Obs Buy" (Orange Label) → Possible buy setup, but missing confirmation.
⚠️ "Obs Sell" (Orange Label) → Possible sell setup, but missing confirmation.
Momentum Reversal Markers (Strong Buy/Sell Signals)
🔺 "Bull M" (Green Triangle) → Strong bullish momentum shift detected.
🔻 "Bear M" (Red Triangle) → Strong bearish momentum shift detected.
Why This Indicator is Unique & Valuable
✔ Combines multiple indicators (RSI, Supertrend, EMA) with a structured approach.
✔ Avoids false signals by requiring confirmation from price action.
✔ Provides persistent support/resistance levels to track active trades.
✔ Visually clean and easy to use with minimal chart clutter.
This indicator is suitable for swing traders, intraday traders, and positional traders who want high-probability setups with clear trend direction.
Note di rilascio
Changes in the Updated Version of Dynamic Momentum Shift Detector [Invesmate]Buy/Sell Confirmation Criteria Updated:
Buy Confirmation:
Candle body size requirement changed from ≥ 40% to ≥ 30% of range.
Sell Confirmation:
Candle body size requirement changed from ≥ 40% to ≥ 20% of range.
These changes improve trade frequency and adaptability while maintaining signal reliability.
No other modifications were made to the core logic of the indicator. 🚀
Script protetto
Questo script è pubblicato come codice protetto. Tuttavia, è possibile utilizzarle liberamente e senza alcuna limitazione – ulteriori informazioni qui.
Declinazione di responsabilità
Le informazioni e le pubblicazioni non sono intese come, e non costituiscono, consulenza o raccomandazioni finanziarie, di investimento, di trading o di altro tipo fornite o approvate da TradingView. Per ulteriori informazioni, consultare i Termini di utilizzo.