OPEN-SOURCE SCRIPT
Pivot Point (MM)
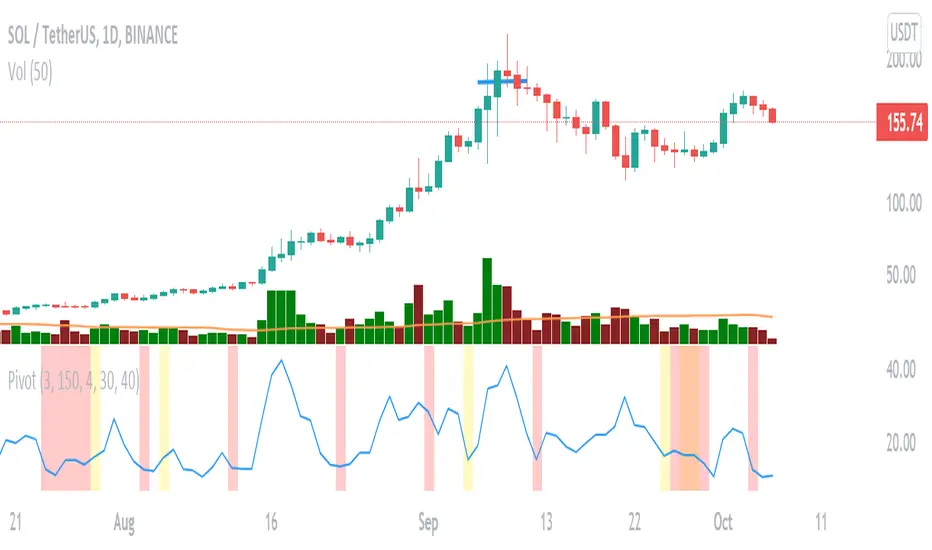
It helps indicate the contraction point so that we can have a low-risk entry of a buy point.
It followed the strategy of Mark Minervini.
changing the lookback period input to change the percentile
changing the Pivot Length to decide how many bars you would consider as a pivot
changing the Close range to decide in how much percentage does the close range you would consider as a pivot
The percentile rank is represented in the colour of the background, you can alter how low you want to set to indicate lowering volatility.
The blue line shows the percentage range in ( pivot length) days/bars
The coloured background shows the signal of pivot point forming
Script open-source
Nello spirito di TradingView, l'autore di questo script lo ha reso open source, in modo che i trader possano esaminarne e verificarne la funzionalità. Complimenti all'autore! Sebbene sia possibile utilizzarlo gratuitamente, ricordiamo che la ripubblicazione del codice è soggetta al nostro Regolamento.
Declinazione di responsabilità
Le informazioni e le pubblicazioni non sono intese come, e non costituiscono, consulenza o raccomandazioni finanziarie, di investimento, di trading o di altro tipo fornite o approvate da TradingView. Per ulteriori informazioni, consultare i Termini di utilizzo.