PROTECTED SOURCE SCRIPT
PrismNorm (Anchored)
# PrismNorm (Anchored)
Overview
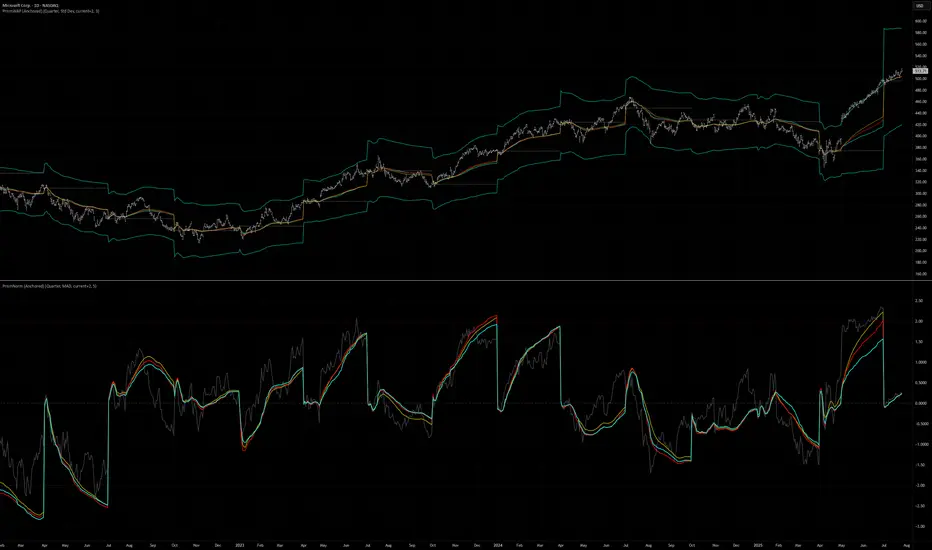
PrismNorm plots anchored, span-normalized price averages (VWAP, TWAP, TrueWAP) alongside a half-price line, with all series scaled by a blended volatility measure. This frames price swings across anchor periods of varying lengths in units of recent volatility.
How It Works
On each new anchor span (session, week, month, etc.), the script:
• Resets an anchor line to the first bar’s open.
• Computes raw VWAP, TWAP, TrueWAP and a half-price delta (close–anchor)/2 cumulatively over the span.
• Calculates a deviation metric (Std Dev, MAD, ATR-scaled, or Percent of anchor price) for the current span.
• Blends the current span’s deviation with up to N prior spans (for non-Percent modes).
• Divides each net price series by the blended deviation to yield normalized outputs.
Inputs
Settings / Description
• Anchor Period / Span for resetting the anchor line (Week, Month, etc.)
• Deviation Measure / Volatility method for normalization: Std Dev, MAD, ATR (scaled), or Percent
• Normalization Interval / Number of past spans (current+1 … current+10) to include in blended deviation
• Percent Deviation (%) / Band width % when Percent mode is selected (applied to anchor price)
• Scale MAD to σ / Scale MAD by √(π/2) so it aligns with σ under Normal distribution
Display
• Show Normalized VWAP
• Show Normalized TWAP
• Show Normalized TrueWAP
• Show Normalized Price (½×)
Tips & Use Cases
• Use shorter anchor spans (Session, Week) for intraday normalization.
• Use longer spans (Quarter, Year) to compare price action across macro periods.
References:
1. TrueWAP Description
2. SD, MAD, ATR (scaled) Deviation Measure Methodology
## 1. TrueWAP: Volatility-Weighted Price Averaging
What Is TrueWAP?
TrueWAP plugs actual price fluctuations into your average. Instead of only tracking time (TWAP) or volume (VWAP), it weights each bar’s TrueMid (TrueRange midpoint) by its TrueRange—so when the market moves more, that bar counts more.
In short, it’s a *TrueRange-weighted TrueMid average* anchored at your start date.
TrueWAP (Anchored) Overview
• On the first bar, it uses the simple high-low midpoint for price and the bar’s high-low range for weighting.
• From the next bar onward, it computes TrueMid (TrueRange midpoint).
• Each TrueMid is weighted by its TrueRange and cumulatively summed from the anchor point.
Pseudocode
// TWAP Example for Comparison
current_days = BarsSince("start_of_period")
OHLC = (Open + High + Low + Close) / 4
TWAP = MA(OHLC, current_days)
// VWAP Example for Comparison
current_days = BarsSince("start_of_period")
HLC3 = (High + Low + Close) / 3
VWAP = Sum(HLC3 * Volume, current_days) / Sum(Volume, current_days)
// TrueWAP (Anchored)
current_days = BarsSince("start_of_period") // Count of bars since the period began
first_bar = (current_days == 0) // Boolean flag if current bar is 1st of period
hilo_mid = (High + Low) / 2
max_val = max(Close[-1], High)
min_val = min(Close[-1], Low)
true_mid = (max_val + min_val) / 2
// Use hilo_mid and (High - Low) for the first bar; otherwise, use true_mid and True Range
mid_val = IF(first_bar, hilo_mid, true_mid)
range_val = IF(first_bar, (High - Low), TrueRange)
TrueWAP = Sum(mid_val * range_val, current_days) / Sum(range_val, current_days)
Recap: Interpretation
• The first bar uses the simple high-low midpoint and range.
• Subsequent bars use TrueMid and TrueRange based on prior close.
• This ensures the average reflects only the observed volatility and price since the anchor.
A Note on True Range
TrueRange captures the full extent of bar-to-bar volatility as the maximum of:
• High – Low
• |High – Previous Close|
• |Low – Previous Close|
## 2. SD, MAD, ATR (scaled) Deviation Measure Methodology: Segmented Weighted-Average Volatility
### Introduction
Conventional standard deviation calculations aggregate data over an expanding window and rely on a single mean, producing one summary statistic. This can obscure segmented, sequential datasets—such as MTD, QTD, and YTD—where additional granularity and time-sensitive insights matter.
This methodology isolates standard deviation within defined time frames and then proportionally allocates them based on custom lookback criteria. The result is a dynamic, multi-period normalization benchmark that captures both emerging volatility and historical stability.
Note: While this example uses SD, the same fixed-point approach applies to MAD and ATR (scaled).
### 2.1 Standard Deviation (Rolling Window)
pseudocode
// -- STANDARD DEVIATION (ROLLING) Calculation --
window_size = 20
rolling_SD = STDDEV(Close, window_size)
• Ideal for immediate trading insights.
• Reflects pure, short-term price dynamics.
• Captures volatility using the most recent 20 bars.
### 2.2 Blended SD: Current + 3 Past Periods
This method fuses current month data with the last three complete months.
pseudocode
// -- MULTI-PERIOD STANDARD DEVIATION (PROXY) with Three Past Periods --
current_days = BarsSince("start_of_month")
current_SD = STDDEV(Close, current_days)
prev1_days = TradingDaysLastMonth
prev1_SD = STDDEV_LastMonth(Close)
prev2_days = TradingDaysTwoMonthsAgo
prev2_SD = STDDEV_TwoMonthsAgo(Close)
prev3_days = TradingDaysThreeMonthsAgo
prev3_SD = STDDEV_ThreeMonthsAgo(Close)
// Blending with Proportional Weights
Weighted_SD = (current_SD * current_days +
prev1_SD * prev1_days +
prev2_SD * prev2_days +
prev3_SD * prev3_days) /
(current_days + prev1_days + prev2_days + prev3_days)
• Merges evolving volatility with the stability of three prior months.
• Weights each period by its trading days.
• Yields a robust normalization benchmark.
### 2.3 Blended SD: Current + 1 Past Period
This variant tempers emerging volatility by blending the current month with last month only.
pseudocode
// -- MULTI-PERIOD STANDARD DEVIATION (PROXY) with One Past Period --
current_days = BarsSince("start_of_month")
current_SD = STDDEV(Close, current_days)
prev1_days = TradingDaysLastMonth
prev1_SD = STDDEV_LastMonth(Close)
// Proportional Blend
Weighted_SD = (current_SD * current_days +
prev1_SD * prev1_days) /
(current_days + prev1_days)
• Anchors current volatility to last month’s baseline.
• Softens spikes by blending with historical data.
Conclusion
Segmented weighted-average volatility transforms global benchmarking by integrating immediate market dynamics with historical context. This fixed-point approach—applicable to SD, MAD, and ATR (scaled)—delivers time-sensitive analysis.
Overview
PrismNorm plots anchored, span-normalized price averages (VWAP, TWAP, TrueWAP) alongside a half-price line, with all series scaled by a blended volatility measure. This frames price swings across anchor periods of varying lengths in units of recent volatility.
How It Works
On each new anchor span (session, week, month, etc.), the script:
• Resets an anchor line to the first bar’s open.
• Computes raw VWAP, TWAP, TrueWAP and a half-price delta (close–anchor)/2 cumulatively over the span.
• Calculates a deviation metric (Std Dev, MAD, ATR-scaled, or Percent of anchor price) for the current span.
• Blends the current span’s deviation with up to N prior spans (for non-Percent modes).
• Divides each net price series by the blended deviation to yield normalized outputs.
Inputs
Settings / Description
• Anchor Period / Span for resetting the anchor line (Week, Month, etc.)
• Deviation Measure / Volatility method for normalization: Std Dev, MAD, ATR (scaled), or Percent
• Normalization Interval / Number of past spans (current+1 … current+10) to include in blended deviation
• Percent Deviation (%) / Band width % when Percent mode is selected (applied to anchor price)
• Scale MAD to σ / Scale MAD by √(π/2) so it aligns with σ under Normal distribution
Display
• Show Normalized VWAP
• Show Normalized TWAP
• Show Normalized TrueWAP
• Show Normalized Price (½×)
Tips & Use Cases
• Use shorter anchor spans (Session, Week) for intraday normalization.
• Use longer spans (Quarter, Year) to compare price action across macro periods.
References:
1. TrueWAP Description
2. SD, MAD, ATR (scaled) Deviation Measure Methodology
## 1. TrueWAP: Volatility-Weighted Price Averaging
What Is TrueWAP?
TrueWAP plugs actual price fluctuations into your average. Instead of only tracking time (TWAP) or volume (VWAP), it weights each bar’s TrueMid (TrueRange midpoint) by its TrueRange—so when the market moves more, that bar counts more.
In short, it’s a *TrueRange-weighted TrueMid average* anchored at your start date.
TrueWAP (Anchored) Overview
• On the first bar, it uses the simple high-low midpoint for price and the bar’s high-low range for weighting.
• From the next bar onward, it computes TrueMid (TrueRange midpoint).
• Each TrueMid is weighted by its TrueRange and cumulatively summed from the anchor point.
Pseudocode
// TWAP Example for Comparison
current_days = BarsSince("start_of_period")
OHLC = (Open + High + Low + Close) / 4
TWAP = MA(OHLC, current_days)
// VWAP Example for Comparison
current_days = BarsSince("start_of_period")
HLC3 = (High + Low + Close) / 3
VWAP = Sum(HLC3 * Volume, current_days) / Sum(Volume, current_days)
// TrueWAP (Anchored)
current_days = BarsSince("start_of_period") // Count of bars since the period began
first_bar = (current_days == 0) // Boolean flag if current bar is 1st of period
hilo_mid = (High + Low) / 2
max_val = max(Close[-1], High)
min_val = min(Close[-1], Low)
true_mid = (max_val + min_val) / 2
// Use hilo_mid and (High - Low) for the first bar; otherwise, use true_mid and True Range
mid_val = IF(first_bar, hilo_mid, true_mid)
range_val = IF(first_bar, (High - Low), TrueRange)
TrueWAP = Sum(mid_val * range_val, current_days) / Sum(range_val, current_days)
Recap: Interpretation
• The first bar uses the simple high-low midpoint and range.
• Subsequent bars use TrueMid and TrueRange based on prior close.
• This ensures the average reflects only the observed volatility and price since the anchor.
A Note on True Range
TrueRange captures the full extent of bar-to-bar volatility as the maximum of:
• High – Low
• |High – Previous Close|
• |Low – Previous Close|
## 2. SD, MAD, ATR (scaled) Deviation Measure Methodology: Segmented Weighted-Average Volatility
### Introduction
Conventional standard deviation calculations aggregate data over an expanding window and rely on a single mean, producing one summary statistic. This can obscure segmented, sequential datasets—such as MTD, QTD, and YTD—where additional granularity and time-sensitive insights matter.
This methodology isolates standard deviation within defined time frames and then proportionally allocates them based on custom lookback criteria. The result is a dynamic, multi-period normalization benchmark that captures both emerging volatility and historical stability.
Note: While this example uses SD, the same fixed-point approach applies to MAD and ATR (scaled).
### 2.1 Standard Deviation (Rolling Window)
pseudocode
// -- STANDARD DEVIATION (ROLLING) Calculation --
window_size = 20
rolling_SD = STDDEV(Close, window_size)
• Ideal for immediate trading insights.
• Reflects pure, short-term price dynamics.
• Captures volatility using the most recent 20 bars.
### 2.2 Blended SD: Current + 3 Past Periods
This method fuses current month data with the last three complete months.
pseudocode
// -- MULTI-PERIOD STANDARD DEVIATION (PROXY) with Three Past Periods --
current_days = BarsSince("start_of_month")
current_SD = STDDEV(Close, current_days)
prev1_days = TradingDaysLastMonth
prev1_SD = STDDEV_LastMonth(Close)
prev2_days = TradingDaysTwoMonthsAgo
prev2_SD = STDDEV_TwoMonthsAgo(Close)
prev3_days = TradingDaysThreeMonthsAgo
prev3_SD = STDDEV_ThreeMonthsAgo(Close)
// Blending with Proportional Weights
Weighted_SD = (current_SD * current_days +
prev1_SD * prev1_days +
prev2_SD * prev2_days +
prev3_SD * prev3_days) /
(current_days + prev1_days + prev2_days + prev3_days)
• Merges evolving volatility with the stability of three prior months.
• Weights each period by its trading days.
• Yields a robust normalization benchmark.
### 2.3 Blended SD: Current + 1 Past Period
This variant tempers emerging volatility by blending the current month with last month only.
pseudocode
// -- MULTI-PERIOD STANDARD DEVIATION (PROXY) with One Past Period --
current_days = BarsSince("start_of_month")
current_SD = STDDEV(Close, current_days)
prev1_days = TradingDaysLastMonth
prev1_SD = STDDEV_LastMonth(Close)
// Proportional Blend
Weighted_SD = (current_SD * current_days +
prev1_SD * prev1_days) /
(current_days + prev1_days)
• Anchors current volatility to last month’s baseline.
• Softens spikes by blending with historical data.
Conclusion
Segmented weighted-average volatility transforms global benchmarking by integrating immediate market dynamics with historical context. This fixed-point approach—applicable to SD, MAD, and ATR (scaled)—delivers time-sensitive analysis.
Script protetto
Questo script è pubblicato come codice protetto. Tuttavia, è possibile utilizzarle liberamente e senza alcuna limitazione – ulteriori informazioni qui.
Declinazione di responsabilità
Le informazioni e le pubblicazioni non sono intese come, e non costituiscono, consulenza o raccomandazioni finanziarie, di investimento, di trading o di altro tipo fornite o approvate da TradingView. Per ulteriori informazioni, consultare i Termini di utilizzo.