PROTECTED SOURCE SCRIPT
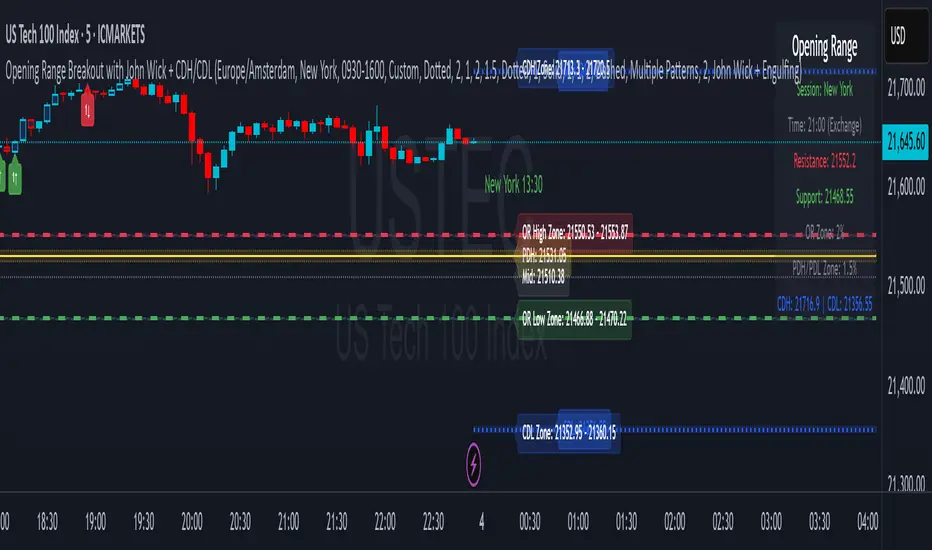
Opening Range Breakout with John Wick + CDH/CDL
Opening Range Breakout (ORB) De Luxe with John Wick Pattern - User Manual Table of Contents
1. Introduction
2. Key Features
3. Installation
4. Configuration Guide
5. Trading Signals
6. Pattern Recognition
7. Zone Trading
8. Alert Setup
9. Trading Strategies
10. Best Practices
11. Troubleshooting
________________________________________
1. Introduction The Opening Range Breakout (ORB) with John Wick indicator is a comprehensive trading tool designed for intraday and swing traders. It combines the classic Opening Range Breakout strategy with advanced candlestick pattern recognition, including the unique "John Wick" pattern. What is Opening Range Breakout? The Opening Range (OR) is the price range established during the first 15 minutes of a trading session. This range often acts as support and resistance for the remainder of the trading day. Breakouts above or below this range can signal strong directional moves. Key Concepts: • Opening Range High: The highest price during the first 15 minutes • Opening Range Low: The lowest price during the first 15 minutes • Breakout: Price movement above OR High (bullish) or below OR Low (bearish) • Pattern Zones: Areas around key levels where pattern recognition is most effective • PDH/PDL: Previous Day High and Previous Day Low - key reference levels from the prior trading day • CDH/CDL: Current Day High and Current Day Low - dynamically updating intraday extremes
________________________________________
2. Key Features Core Features: • Multi-Session Support: New York, London, Tokyo, Sydney, Frankfurt, and Custom sessions • Opening Range Visualization: Automatic OR High/Low detection and plotting • Pattern Recognition: Engulfing, Hammer/Shooting Star, Doji, and John Wick patterns • Zone Trading: Customizable zones around OR and PDH/PDL/CDH/CDL levels • Previous Day Levels: PDH (Previous Day High) and PDL (Previous Day Low) • Current Day Levels: CDH (Current Day High) and CDL (Current Day Low) - real-time tracking • Mid-Point Levels: Automatic calculation of OR mid-point • Real-Time Alerts: Breakout and pattern-based alerts • Multi-Timezone Support: Exchange or custom timezone selection Visual Features: • Dynamic color-coded levels • Triangle signals for breakouts • Pattern labels with clear identification • Information table with current session data • Fully customizable colors and styles
________________________________________
3. Installation Step 1: Add to Chart
4. Open TradingView and navigate to your desired chart
5. Click on "Indicators" (or press /)
6. Search for "Opening Range Breakout with John Wick"
7. Click to add the indicator to your chart Step 2: Initial Setup
8. The indicator will automatically detect your chart's timezone
9. Default session is set to "New York"
10. All features are enabled by default Recommended Timeframes: • Optimal: 1-minute to 15-minute charts • Suitable: Up to 1-hour charts • Not Recommended: Daily or higher timeframes
________________________________________
4. Configuration Guide Timezone Settings Use Exchange Timezone • Enabled (Default): Uses the exchange's native timezone • Disabled: Uses chart timezone or custom selection Timezone Selection Available when "Use Exchange Timezone" is disabled: • America/New_York • Europe/London • Europe/Amsterdam • Asia/Tokyo • Australia/Sydney Session Selection Trading Sessions • Sydney: 09:00-16:00 Sydney time • Tokyo: 09:00-15:00 Tokyo time • London: 08:00-16:30 London time • Frankfurt: 09:00-17:30 Frankfurt time • New York: 09:30-16:00 New York time • Custom: User-defined session • Previous Sessions: Shows multiple historical ORs Custom Session Settings • Custom Session Time: Define your own trading hours • Custom Session Name: Label for your custom session Display Options Line Settings • Line Width: 1-5 (Default: 2) • Line Style: Solid, Dashed, or Dotted • Show Current Only: Hide historical OR lines • Show Session Name: Display session label on chart Color Customization • OR Resistance (High): Default red • OR Support (Low): Default green • Session Colors: Unique color per session type • Zone Colors: Separate colors for OR and PDH/PDL zones Pattern Zone Settings Zone Configuration • Show Pattern Detection Zone: Enable/disable zones • OR Zone Size: Percentage of OR range (Default: 2%) • PDH/PDL Zone Size: Percentage of PDH-PDL range (Default: 1.5%) • CDH/CDL Zone Size: Percentage of CDH-CDL range (Default: 1.5%) • Show Zone Labels: Display zone boundary values • Only Detect Patterns in Zone: Limit pattern detection to zones Mid-Point Settings • Show Opening Range Mid-Point: Display OR midline • Mid-Point Color: Default gray • Mid-Point Style: Dotted, Dashed, or Solid • Show Mid-Point Label: Display midpoint value Previous Day Levels • Show Previous Day High/Low: Enable PDH/PDL lines • PDH/PDL Colors: Default yellow • PDH/PDL Line Style: Customizable style • Show PDH/PDL Labels: Display level values
Current Day Levels • Show Current Day High/Low: Enable CDH/CDL lines • CDH/CDL Colors: Default blue • CDH/CDL Line Style: Customizable style • Show CDH/CDL Labels: Display level values • Update Frequency: Real-time updates as new highs/lows are made
________________________________________
5. Trading Signals Signal Types
6. Breakout Signals • Bullish (Buy): Green triangle below candle when price breaks above OR High • Bearish (Sell): Red triangle above candle when price breaks below OR Low
7. Pattern-Enhanced Signals Signals are generated when breakouts occur WITH confirming patterns: • Stronger probability of follow-through • Reduced false breakouts • Better risk/reward setups Signal Configuration Alert Settings • Enable Alerts: Turn alerts on/off • Show Buy/Sell Signals: Visual signals on chart • Show Signal Text: Display "BUY"/"SELL" labels Pattern Filter Options • Use Candle Pattern Filter: Require patterns for signals • Pattern Combination Mode: o Any Pattern: Signal on any single pattern o Multiple Patterns: Require minimum pattern count o Specific Combo: Require specific pattern combinations
________________________________________
6. Pattern Recognition Supported Patterns
7. Engulfing Pattern • Bullish Engulfing: Large green candle completely engulfs previous red candle • Bearish Engulfing: Large red candle completely engulfs previous green candle • Label: "E"
8. Hammer/Shooting Star • Hammer: Small body at top, long lower wick (2x body size) • Shooting Star: Small body at bottom, long upper wick (2x body size) • Labels: "H" (Hammer), "S" (Shooting Star)
9. Doji Pattern • Definition: Open and close nearly equal (body < 10% of average) • Significance: Indecision, potential reversal • Label: "D"
10. John Wick Pattern (Unique Feature) • Bullish John Wick: o Opens below previous candle's low o 30-70% of body extends below previous low o Strong momentum indication • Bearish John Wick: o Opens above previous candle's high o 30-70% of body extends above previous high • Label: "JW" Pattern Visualization • Pattern Markers: Small circular labels with pattern abbreviations • Pattern Count: Number showing total patterns detected • Pattern Background: Optional highlighting (disabled by default) • Positioning: o Bullish patterns: Below candles at varying distances o Bearish patterns: Above candles at varying distances
________________________________________
7. Zone Trading Zone Concept Zones are buffer areas around key levels where price action and patterns are monitored more closely. Zone Types
8. Opening Range Zones • OR High Zone: Area around the OR High level • OR Low Zone: Area around the OR Low level • Purpose: Identify potential breakout or rejection areas
9. PDH/PDL Zones • PDH Zone: Area around Previous Day High • PDL Zone: Area around Previous Day Low • Purpose: Monitor reactions at key daily levels
10. CDH/CDL Zones • CDH Zone: Area around Current Day High • CDL Zone: Area around Current Day Low • Purpose: Track reactions at evolving intraday extremes • Dynamic Nature: These zones move as new highs/lows are established Zone Features • Visual Representation: Semi-transparent colored boxes • Customizable Size: Percentage-based calculation • Pattern Detection: Option to only detect patterns within zones • Bar Coloring: Candles change color when in zones Zone Trading Strategy
11. Wait for price to enter a zone
12. Look for pattern formation within the zone
13. Trade breakouts with pattern confirmation
14. Use zone boundaries as stop-loss references
________________________________________
8. Alert Setup Creating Alerts Step 1: Basic Alert Setup
9. Right-click on the chart
10. Select "Add Alert"
11. Choose "ORB The Luxe" from Condition dropdown
12. Select alert type Step 2: Alert Types • Any alert() function call: All indicator alerts • Crossed above OR High: Bullish breakout • Crossed below OR Low: Bearish breakout Alert Messages Alerts include: • Session name (e.g., "New York") • Direction (above/below) • Level crossed • Pattern detected (if applicable) • Zone information (if in zone) Alert Best Practices
13. Set alerts after the OR is established (15+ minutes into session)
14. Use pattern filters to reduce false signals
15. Consider zone alerts for higher probability setups
16. Set stop-loss alerts at opposite OR level
________________________________________
9. Trading Strategies Strategy 1: Classic ORB
10. Entry: o Long: Break above OR High o Short: Break below OR Low
11. Stop Loss: Opposite OR level
12. Target: 1:2 or 1:3 risk/reward
13. Best Time: First 2 hours after OR Strategy 2: ORB with Pattern Confirmation
14. Entry Requirements: o Breakout signal o At least one confirming pattern o Preferably within a zone
15. Stop Loss: Mid-point of OR
16. Target: Previous day's high/low or current day's high/low
17. Win Rate: Higher than classic ORB Strategy 3: Zone Rejection Trading
18. Setup: Price enters zone but fails to break OR
19. Entry: Reversal pattern in zone
20. Stop Loss: Just outside zone boundary
21. Target: Opposite OR level
22. Best For: Range-bound markets Strategy 4: Multi-Session Confluence
23. Look for: Alignment of multiple session ORs
24. Entry: Break of aligned levels
25. Confirmation: Pattern at confluence point
26. Target: Extended moves expected
27. Additional Edge: Watch for CDH/CDL tests during the session
Strategy 5: CDH/CDL Breakout Trading
1. Setup: Price approaches current day's high or low
2. Entry: Break and hold above CDH or below CDL
3. Confirmation: Volume increase or pattern formation
4. Stop Loss: Just inside the CDH/CDL level
5. Target: Measured move based on intraday range
6. Best For: Trending days with momentum Risk Management Rules • Position Size: Risk 1-2% per trade • Max Daily Loss: 3-5% of account • Avoid: First and last 15 minutes of session • Best Days: Tuesday through Thursday
________________________________________
10. Best Practices Do's:
• Wait for OR to be established (15 minutes)
• Use multiple confirmations (pattern + zone + volume)
• Trade in the direction of the larger trend
• Set alerts to avoid missing opportunities
• Keep a trading journal of ORB trades
• Adjust zones based on market volatility
• Use proper position sizing Don'ts:
• Trade immediately at market open
• Ignore the overall market context
• Trade every OR breakout
• Use in choppy/low volume markets
• Set stops too close to entry
• Trade against strong trends
• Over-leverage positions Market Conditions Best Performance: • Trending days • High volume sessions • Economic news days • Clear market sentiment Avoid During: • Low volume holidays • Extremely choppy conditions • Major uncertainty events • End of month/quarter repositioning
________________________________________
11. Troubleshooting Common Issues and Solutions Issue: No signals appearing Solutions: • Ensure "Show Buy/Sell Signals" is enabled • Check if pattern filter is too restrictive • Verify correct session is selected • Confirm market has broken OR levels Issue: Too many false signals Solutions: • Enable pattern filter requirement • Use "Multiple Patterns" mode • Trade only within zones • Increase zone size percentage Issue: Incorrect session times Solutions: • Check timezone settings • Verify exchange timezone option • Use custom session for specific needs • Ensure chart timeframe is appropriate Issue: Overlapping indicators Solutions: • Disable pattern markers if too cluttered • Turn off signal text • Hide PDH/PDL or CDH/CDL if not needed • Use "Show Current Only" option Performance Tips
12. Reduce Chart Load: Hide historical sessions
13. Clean View: Disable unused pattern types
14. Mobile Trading: Increase line widths for visibility
15. Multiple Monitors: Use different sessions per screen Getting Help • Check indicator settings tooltips • Test on demo account first • Document your settings for consistency • Join ORB trading communities for tips
________________________________________
Conclusion The Opening Range Breakout with John Wick indicator is a powerful tool that combines time-tested ORB strategies with advanced pattern recognition. Success comes from understanding each component, practicing proper risk management, and adapting the tool to your trading style. Remember: No indicator guarantees profits. Always use proper risk management and continuous education to improve your trading results. Happy Trading!
________________________________________
Version: 1.0 Last Updated: June 2025 Pine Script Version: 6
Script protetto
Questo script è pubblicato come codice protetto. Tuttavia, è possibile utilizzarle liberamente e senza alcuna limitazione – ulteriori informazioni qui.
Declinazione di responsabilità
Le informazioni e le pubblicazioni non sono intese come, e non costituiscono, consulenza o raccomandazioni finanziarie, di investimento, di trading o di altro tipo fornite o approvate da TradingView. Per ulteriori informazioni, consultare i Termini di utilizzo.