OPEN-SOURCE SCRIPT
Relative Price Difference [LAVA]
EDIT: Look below for updates to the script.
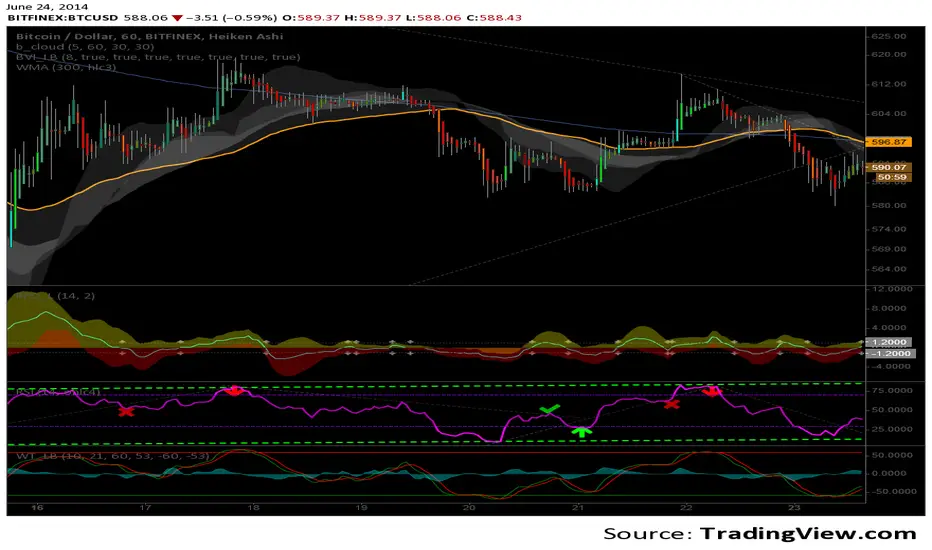
EDIT: After several updates to this script, I think it's safe to say it will work with all timelines. Using hand drawn trendlines, it can predict tops and bottoms with pretty good accuracy.
Shows a change in the relative price difference via percentage on a 0 horizontal. Added a bollinger band to help identify weak areas (orange). If orange starts showing, the current price direction is strong but can reverse harshly. If you are in a weak position, exit here. Otherwise, don't enter a trade after/during orange sessions until a full cycle (up/dn > 1% without orange) has completed. The main line indicator fluctuates according to the price difference. 1% horizontal lines are added to help identify profit taking spots or OTE zones. Ensure the 1% line is crossed completely before you decide to enter/exit. Cross points are identified with crosses if you missed your window, this is the last spot to exit, enter. This indicator doesn't work that well with small time intervals. As always, use more than one indicator to ensure your decision is right. (The colors are ugly so change them if you wish! :)
Script open-source
In pieno spirito TradingView, il creatore di questo script lo ha reso open-source, in modo che i trader possano esaminarlo e verificarne la funzionalità. Complimenti all'autore! Sebbene sia possibile utilizzarlo gratuitamente, ricorda che la ripubblicazione del codice è soggetta al nostro Regolamento.
Declinazione di responsabilità
Le informazioni ed i contenuti pubblicati non costituiscono in alcun modo una sollecitazione ad investire o ad operare nei mercati finanziari. Non sono inoltre fornite o supportate da TradingView. Maggiori dettagli nelle Condizioni d'uso.