Earlier this week, published an idea on how harmonic patterns can be used for trend following. This script is an attempt to implement the same.
🎲 Process
🎯 Derive Zigzag and scan harmonic patterns for last 5 confirmed pivots
🎯 If a pattern is found, highest point of pattern will become the bullish zone and lower point of the pattern will become bearish zone.
🎯 Since it is trend following method, when price reaches bullish zone, then the trend is considered as bullish and when price reaches bearish zone, the trend is considered as bearish.
🎯 If price does not touch both regions, then trend remains unchanged.
🎯 Bullish and bearish zone will change as and when new patterns are formed.
🎲 Note
Patterns are not created on latest pivot as last pivot will be unconfirmed and moving. Due to this, patterns appear after certain delay - patterns will not be real time. But, this is expected and does not impact the overall process.
When new pattern formed
https://www.tradingview.com/x/gGYDQ0xq/
When price breaks over the zones
https://www.tradingview.com/x/rJjgkJ0Y/
🎲 Output
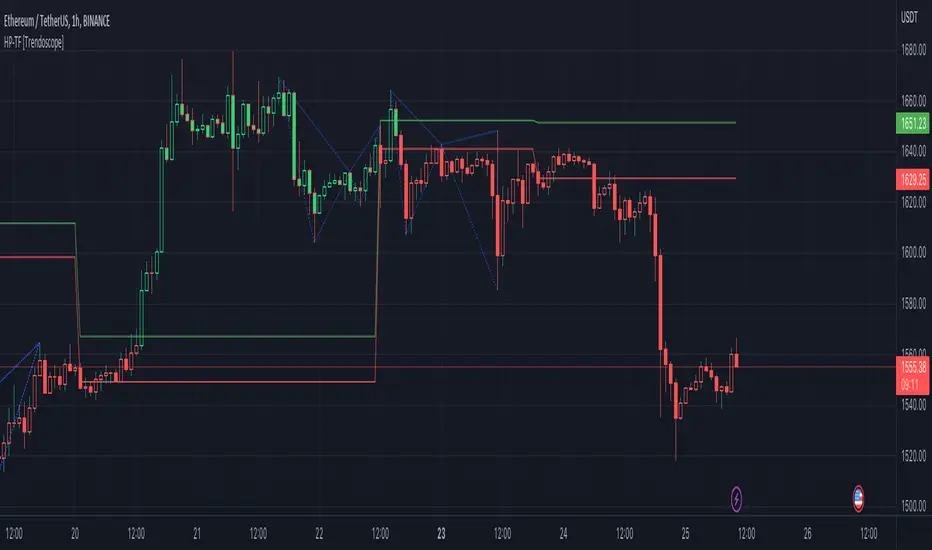
🎯 Patterns formed are drawn in blue coloured lines. Due to pine limitation of max 500 lines, older patterns automatically get deleted when new ones come.
🎯 Bullish Zone and Bearish Zone are plotted in green and red colours and the zone will change whenever new pattern comes along.
🎯 Bar colors are changed according to calculated trend. Trend value can be 1 or -1 based on the current trend. You can also find the value in data window.
🎯 For simplicity purpose, input option for selection of specific patterns are not provided and also pattern names are not displayed on the chart.
🎲 Process
🎯 Derive Zigzag and scan harmonic patterns for last 5 confirmed pivots
🎯 If a pattern is found, highest point of pattern will become the bullish zone and lower point of the pattern will become bearish zone.
🎯 Since it is trend following method, when price reaches bullish zone, then the trend is considered as bullish and when price reaches bearish zone, the trend is considered as bearish.
🎯 If price does not touch both regions, then trend remains unchanged.
🎯 Bullish and bearish zone will change as and when new patterns are formed.
🎲 Note
Patterns are not created on latest pivot as last pivot will be unconfirmed and moving. Due to this, patterns appear after certain delay - patterns will not be real time. But, this is expected and does not impact the overall process.
When new pattern formed
https://www.tradingview.com/x/gGYDQ0xq/
When price breaks over the zones
https://www.tradingview.com/x/rJjgkJ0Y/
🎲 Output
🎯 Patterns formed are drawn in blue coloured lines. Due to pine limitation of max 500 lines, older patterns automatically get deleted when new ones come.
🎯 Bullish Zone and Bearish Zone are plotted in green and red colours and the zone will change whenever new pattern comes along.
🎯 Bar colors are changed according to calculated trend. Trend value can be 1 or -1 based on the current trend. You can also find the value in data window.
🎯 For simplicity purpose, input option for selection of specific patterns are not provided and also pattern names are not displayed on the chart.
Note di rilascio
Updated code to have more input options to determine bullish and bearish range.Note di rilascio
Update signature :)Note di rilascio
Added option to use log scale.Script open-source
In pieno spirito TradingView, il creatore di questo script lo ha reso open-source, in modo che i trader possano esaminarlo e verificarne la funzionalità. Complimenti all'autore! Sebbene sia possibile utilizzarlo gratuitamente, ricorda che la ripubblicazione del codice è soggetta al nostro Regolamento.
Trial - trendoscope.io/trial
Subscribe - trendoscope.io/pricing
Blog - docs.trendoscope.io
Subscribe - trendoscope.io/pricing
Blog - docs.trendoscope.io
Declinazione di responsabilità
Le informazioni ed i contenuti pubblicati non costituiscono in alcun modo una sollecitazione ad investire o ad operare nei mercati finanziari. Non sono inoltre fornite o supportate da TradingView. Maggiori dettagli nelle Condizioni d'uso.
Script open-source
In pieno spirito TradingView, il creatore di questo script lo ha reso open-source, in modo che i trader possano esaminarlo e verificarne la funzionalità. Complimenti all'autore! Sebbene sia possibile utilizzarlo gratuitamente, ricorda che la ripubblicazione del codice è soggetta al nostro Regolamento.
Trial - trendoscope.io/trial
Subscribe - trendoscope.io/pricing
Blog - docs.trendoscope.io
Subscribe - trendoscope.io/pricing
Blog - docs.trendoscope.io
Declinazione di responsabilità
Le informazioni ed i contenuti pubblicati non costituiscono in alcun modo una sollecitazione ad investire o ad operare nei mercati finanziari. Non sono inoltre fornite o supportate da TradingView. Maggiori dettagli nelle Condizioni d'uso.