OPEN-SOURCE SCRIPT
Layering Plots
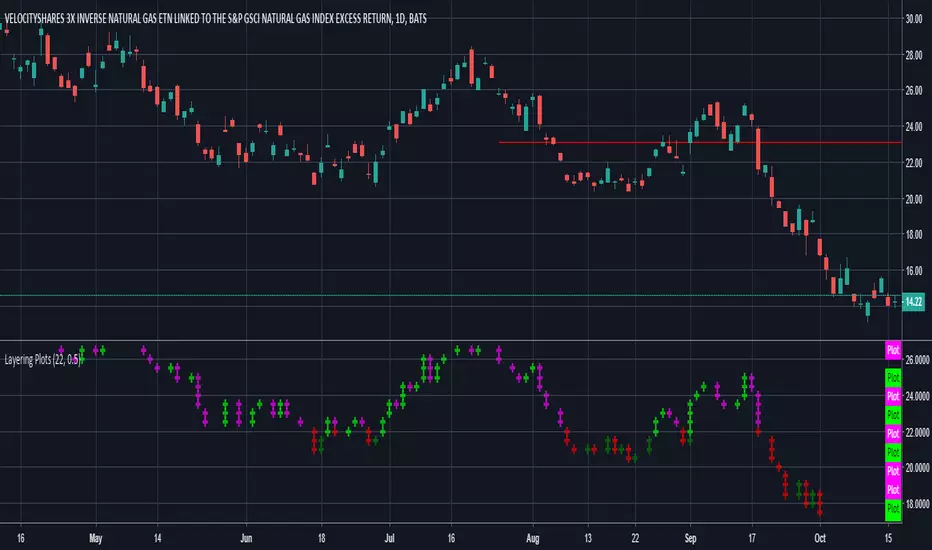
Lets say you want to layer into a position and you'd like to see it turn around. The study lets you set a baseline and increments above and below that baseline. A green cross is plotted ever time the price crosses above one of the increments, and red when crossing below that increment.
In the example I set the baseline to $22.1, and Layer increments to $0.50. So it will plot a cross every 50 cents above and below the baseline. This can be used on any chart period (daily, hourly, 5min...), but is limited to 9 layers above and below the baseline.
NOTES...
Lime = when price crosses above a layer that is above the baseline
Green = when price crosses above a layer below the baseline
Pink = when price crosses below a layer that is above the baseline
Red = when price crosses below a layer below the baseline
IMPORTANT...
This does not plot sometimes. I'm using a crossover crossunder function, and if a candle gaps open below and ends above a layer, this will not plot. It is not in error, just the way that function works. I will be looking to improve this study, wanted to share what I have for now.
Script open-source
Nello spirito di TradingView, l'autore di questo script lo ha reso open source, in modo che i trader possano esaminarne e verificarne la funzionalità. Complimenti all'autore! Sebbene sia possibile utilizzarlo gratuitamente, ricordiamo che la ripubblicazione del codice è soggetta al nostro Regolamento.
Declinazione di responsabilità
Le informazioni e le pubblicazioni non sono intese come, e non costituiscono, consulenza o raccomandazioni finanziarie, di investimento, di trading o di altro tipo fornite o approvate da TradingView. Per ulteriori informazioni, consultare i Termini di utilizzo.