OPEN-SOURCE SCRIPT
Fisher Transform of On Balance Volume (by ChartArt)
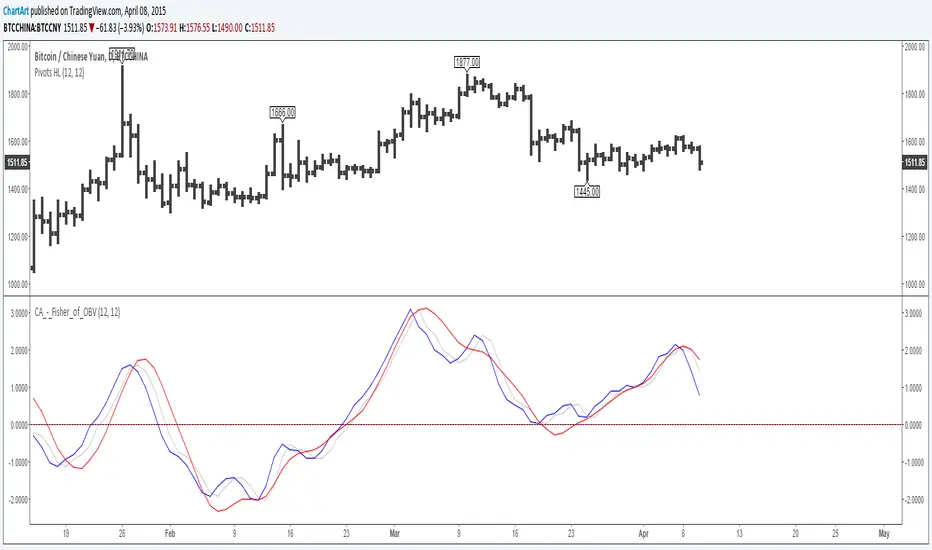
A simple mash-up of the On Balance Volume (OBV) indicator with the Fisher Transform indicator (blue) with the classic Fisher Transform signal trigger (silver color), plus a linear regression as a second signal line (red).
I recommend to use a period for the linear regression which has the same speed or is slower than the period of the Fisher Transform to avoid overshooting.
P.S. Here are three areas where the indicator worked quite good on historic charts


I recommend to use a period for the linear regression which has the same speed or is slower than the period of the Fisher Transform to avoid overshooting.
P.S. Here are three areas where the indicator worked quite good on historic charts
Script open-source
In pieno spirito TradingView, il creatore di questo script lo ha reso open-source, in modo che i trader possano esaminarlo e verificarne la funzionalità. Complimenti all'autore! Sebbene sia possibile utilizzarlo gratuitamente, ricorda che la ripubblicazione del codice è soggetta al nostro Regolamento.
Declinazione di responsabilità
Le informazioni ed i contenuti pubblicati non costituiscono in alcun modo una sollecitazione ad investire o ad operare nei mercati finanziari. Non sono inoltre fornite o supportate da TradingView. Maggiori dettagli nelle Condizioni d'uso.