WMTSTRATEGY - SMC and EMA
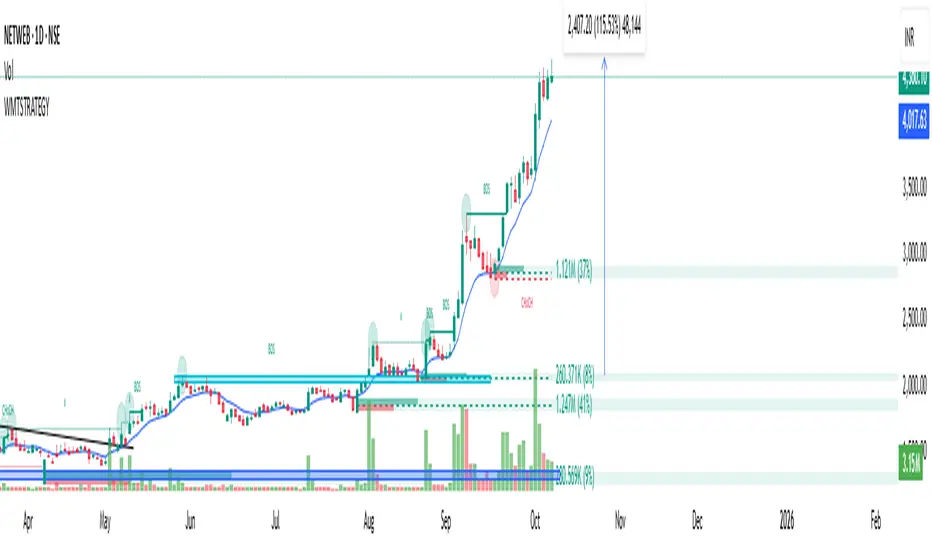
The 9-period Exponential Moving Average (EMA) is a line on a price chart that tracks the average price over the last nine periods, giving more weight to the most recent data. This makes it more responsive to new price changes than a Simple Moving Average (SMA), which weights all periods equally.
How it's used:
Identifies short-term trends: When the price stays consistently above the 9 EMA, it suggests an uptrend. When it stays below, it suggests a downtrend.
Provides dynamic support and resistance: In an uptrend, the price often bounces off the 9 EMA, which acts as a support level. In a downtrend, it acts as resistance.
Generates buy and sell signals: Traders may use price crossing above the 9 EMA as a potential buy signal, and crossing below as a potential sell signal.
SMC: A methodology for institutional analysis
Smart Money Concepts (SMC) is a price action-based trading methodology focused on identifying where institutional "smart money" is entering and exiting the market. It relies on concepts like market structure, order blocks, liquidity grabs, and imbalances to predict market direction, in contrast to traditional retail trading methods.
Key concepts within SMC:
Order Blocks: These are specific candle formations that signify institutional accumulation or distribution and are considered high-probability reversal or continuation zones.
Liquidity Grabs (or Sweeps): The process where institutional traders push the price past a clear high or low to trigger retail traders' stop-loss orders and enter their own positions in the opposite direction.
Market Structure: Analyzing the sequence of higher highs/higher lows (for an uptrend) or lower lows/lower highs (for a downtrend) to determine the overall market direction.
The synergy of 9 EMA and SMC
By combining the 9 EMA with SMC, traders can filter out low-quality signals and improve the precision of their entries and exits.
Strategy example:
Identify the SMC zone: Use SMC analysis to identify a high-probability demand zone (for a long trade) or supply zone (for a short trade). This zone acts as your area of interest for a potential entry.
Wait for price to enter the zone: Wait for the price to retrace into your identified SMC zone.
Confirm the signal with the 9 EMA: On a lower timeframe, wait for the price to cross and close above the 9 EMA (in a demand zone) or below the 9 EMA (in a supply zone). This cross serves as a precise entry trigger, confirming that short-term momentum is shifting in your favor within the high-probability institutional zone.
How this combination adds value:
Filters false signals: SMC helps avoid trading every 9 EMA crossover by only focusing on those that occur within a high-probability institutional zone.
Improves timing: The 9 EMA provides a sensitive entry trigger, preventing premature entries and getting you into a trade as momentum confirms the SMC-identified area of interest.
Boosts confidence: Entering a trade where both institutional footprints (SMC) and short-term momentum (9 EMA) align provides a higher-conviction setup.
Script su invito
Solo gli utenti approvati dall'autore possono accedere a questo script. È necessario richiedere e ottenere l'autorizzazione per utilizzarlo. Tale autorizzazione viene solitamente concessa dopo il pagamento. Per ulteriori dettagli, seguire le istruzioni dell'autore riportate di seguito o contattare direttamente worldmosttrader.
TradingView NON consiglia di pagare o utilizzare uno script a meno che non ci si fidi pienamente del suo autore e non si comprenda il suo funzionamento. Puoi anche trovare alternative gratuite e open-source nei nostri script della comunità.
Istruzioni dell'autore
Declinazione di responsabilità
Script su invito
Solo gli utenti approvati dall'autore possono accedere a questo script. È necessario richiedere e ottenere l'autorizzazione per utilizzarlo. Tale autorizzazione viene solitamente concessa dopo il pagamento. Per ulteriori dettagli, seguire le istruzioni dell'autore riportate di seguito o contattare direttamente worldmosttrader.
TradingView NON consiglia di pagare o utilizzare uno script a meno che non ci si fidi pienamente del suo autore e non si comprenda il suo funzionamento. Puoi anche trovare alternative gratuite e open-source nei nostri script della comunità.