Zeta Force
Zeta Force indicator tracks underlying stocks’ Price & Volume simultaneously to detect sudden momentum in this index.
Based upon its calculations, Zeta Force indicator calculates V+, V-, Zeta Force & Zeta TP variables and generates Buy/Sell signals when major changes are detected in these variables.
Since price is a major factor in Zeta Force calculations and price keeps fluctuating during candle formation, traders need to wait a little to see if the Buy/Sell signal sustains or not.
Once the candle gets closed, the Signal will not repaint itself.
The best time frame to use with this indicator is 15 minute and 10 minute.
Do not use with lower time-frames as settings have been coded for 10 or 15 minute time frame only.
This is only Bank Nifty specific indicator and can not be used for Nifty or other stocks.
Zeta Force indicator tracks underlying stocks’ Price & Volume simultaneously to detect sudden momentum in this index.
Based upon its calculations, Zeta Force indicator calculates V+, V-, Zeta Force & Zeta TP variables and generates Buy/Sell signals when major changes are detected in these variables.
Since price is a major factor in Zeta Force calculations and price keeps fluctuating during candle formation, traders need to wait a little to see if the Buy/Sell signal sustains or not.
Once the candle gets closed, the Signal will not repaint itself.
It works with any time-frame ranging from 3 Minute to 15 minute, but best suited to use with 15 minute and 10 minute time-frames.
Optimum settings coded in the script give best results with 10 Minute & 15 Minute Times frames, but 05 Minute time frame also works nicely, though it will generate more signals.
This is only Bank Nifty specific indicator and can not be used for Nifty or other stocks.
It will be followed by Sell Only as and when Opposite Conditions are met.
This trick has been tamed now in this new version.
The indicator works best on 15 Min. 30 Min. & 01 Hour Time-Frame for Bank Nifty & Nifty.
Do not use on stocks.
1. Blue Diamond
2. Purple Diamond
3. Any Diamond (Blue or Purple)
4. India VIX jumping more than 5% compared to previous daily close.
Also, now there is a provision in settings which enables the user to change the vertical position of Info Label which appears at the last candle.
(a) % change in Indian Currency Vs USD will appear on the info label just below VIX info.
(b) The code has been tweaked to catch absolute bottom and absolute top in 70 to 80% of the cases. In remaining cases, it will catch the trend change within 2-3 candles.
(c) The Zeta Force values used to catch absolute bottom and top have been back-tested using Zeta Algo and most efficient values have been coded-in.
(a) Option Sellers get automatic levels below Support and Above Resistance Respectively where they can Sell Options in a narrow range bound market.
(b) Fair Values of 3 in-the-money Call & Put Strikes is calculated using Black Scholes Formula and displayed on the chart. For this feature to be accurate, you need to give inputs like 'Expiry Date, Expiry Time, Your Time Zone, Bank Rate interest, Implied Volatility etc. in Indicator Settings.
(c) If you can take the trouble to fill-in real time market price of various CE/PE strikes (taken from either NSE India Website or from your Broker's platform, the indicator will even calculate the difference between Fair Value and Actual Market Value and calculate the % variation between both. This will help you find out which strike is being sold at a premium and which strike you are getting at a Discount. For a Sell Signal, look out for Discounted PUT Options and for a Buy Signal, look out for Discounted Call Options.
Some false signals have been filtered and there are 2-3 minor visual enhancements in this new version.
(a) Included code for Oversold & Overbought condition which was missing in the last update.
(b) changed default position of label Display
(a). RSI Value at each candle (you can see this in the green color label which appears at the current candle)
(b). Higher Highs and Lower Lows of current session.
(c). Automatic Level Marking for Buy Entry (Entry above line) and Sell Entry (Entry Below Line). Buy Entry line will be green while Sell Entry line will be red.
(d). Automatic Stop loss marking (High of sell candle and Low of Buy Candle) which will be in Yellow color
What is one-sided move flaw? When an index moves considerably up or down during the session, the indicator used to ignore comparatively small moves in opposite direction.
This could mean failure to book profit in time or being unable to capture smaller movements.
This flaw has been fixed and now opposite signal will come quickly even if Nifty or Bank Nifty has moved 1.5% during the session.
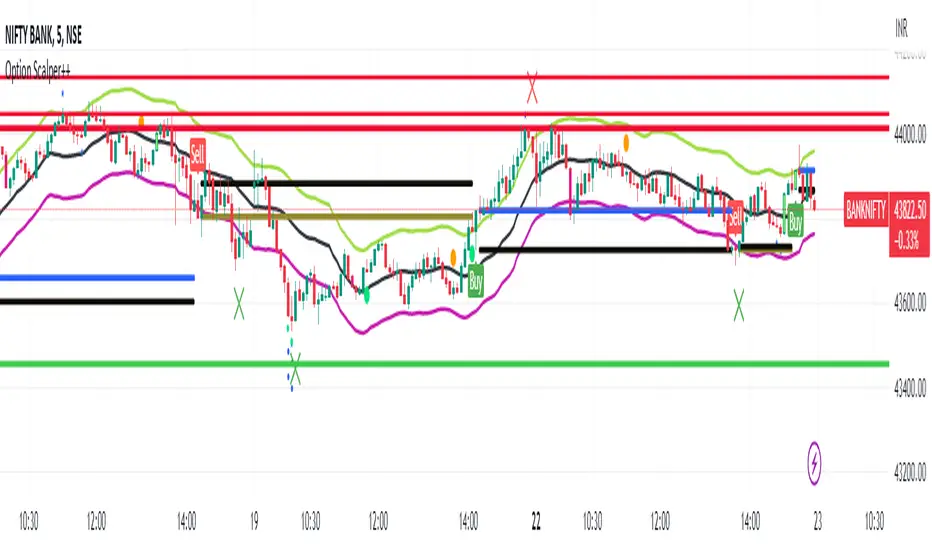
1. Displaying moving average based clouds which we call Green Turf & Red Rock. As long as price is on Green Turf, hold onto your Buy Trade and as long as you price is below Red Rock, hold onto your Sell Trade.
2. Earlier Zeta Force value only for Bank Nifty was visible in the Green Panel below the last candle, now it will change depending upon whether you are watching Nifty chart or Bank Nifty chart.
(a) Introduced Smart Money Foot-print line (thick black color line) which can be used to Exit profitable positions. If your Buy position is in profit, Exit when price goes below this Black Line and if your Sell position is in profit, exit when price goes above Black Line.
(b) Fixed momentum dots (Big, single Orange Dot and Big Single Green Dot) which were repainting in certain situations.
(a) Indication of possible EXIT areas. Red Color X above the candle for your Buy positions and Green Color X below the candle for your Sell positions. The EXIT may or may not be perfect but it really helps. For example, if your Sell position is in profit and a green X cross comes below a candle, EXIT only if next candle is green and appears to close higher than the previous candle where X came. If another lower low is made, hold onto your position and so on. Similarly for a Buy Position, if a Red X comes above a candle, Exit only if a red candle comes which closes below the candle where Red X came. If price continues to make higher highs... keep holding your position. If you EXIT a buy trade in profit because you saw a RED color X followed by a candle which closed below previous candle (where X came), then Buy side Re-Entry is possible when some green candle closes above the last Red X candle and no Sell Signal has come yet.
(b) We have introduced a novel concept of Yellow and Black Candles which form up when there is a hyper activity in the market. At the top of an UpTrend, a Big yellow candle indicates Reversal and at the bottom of a downtrend a Black candle indicates that reversal is coming fast. If a yellow or black candle is small compared to previous 5 to 10 candles, then it should be ignored. When these candles appear during the middle of a trend, for example Yellow candle after Sell Signal and Black candle after Buy signal, they indicator trend continuance where you can add more lots.
After significant gap up or gap down, market tends to be sideways for a major part of the session and only starts trending towards end. The new code aims to detect sideways price-action and tries to minimize some unwanted signals.
Script su invito
Solo gli utenti approvati dall'autore possono accedere a questo script. È necessario richiedere e ottenere l'autorizzazione per utilizzarlo. Tale autorizzazione viene solitamente concessa dopo il pagamento. Per ulteriori dettagli, seguire le istruzioni dell'autore riportate di seguito o contattare direttamente jellygill.
TradingView NON consiglia di acquistare o utilizzare uno script a meno che non si abbia piena fiducia nel suo autore e se ne comprenda il funzionamento. È inoltre possibile trovare alternative gratuite e open source nei nostri script della community.
Istruzioni dell'autore
Telegram: @jellygill
Our Telegram Channel: @CheetaTrader
join to complete FREE TRAINING on how to use the indicators effectively and then request @jellygill for FREE TRIAL
Declinazione di responsabilità
Script su invito
Solo gli utenti approvati dall'autore possono accedere a questo script. È necessario richiedere e ottenere l'autorizzazione per utilizzarlo. Tale autorizzazione viene solitamente concessa dopo il pagamento. Per ulteriori dettagli, seguire le istruzioni dell'autore riportate di seguito o contattare direttamente jellygill.
TradingView NON consiglia di acquistare o utilizzare uno script a meno che non si abbia piena fiducia nel suo autore e se ne comprenda il funzionamento. È inoltre possibile trovare alternative gratuite e open source nei nostri script della community.
Istruzioni dell'autore
Telegram: @jellygill
Our Telegram Channel: @CheetaTrader
join to complete FREE TRAINING on how to use the indicators effectively and then request @jellygill for FREE TRIAL