OPEN-SOURCE SCRIPT
ZoneBars
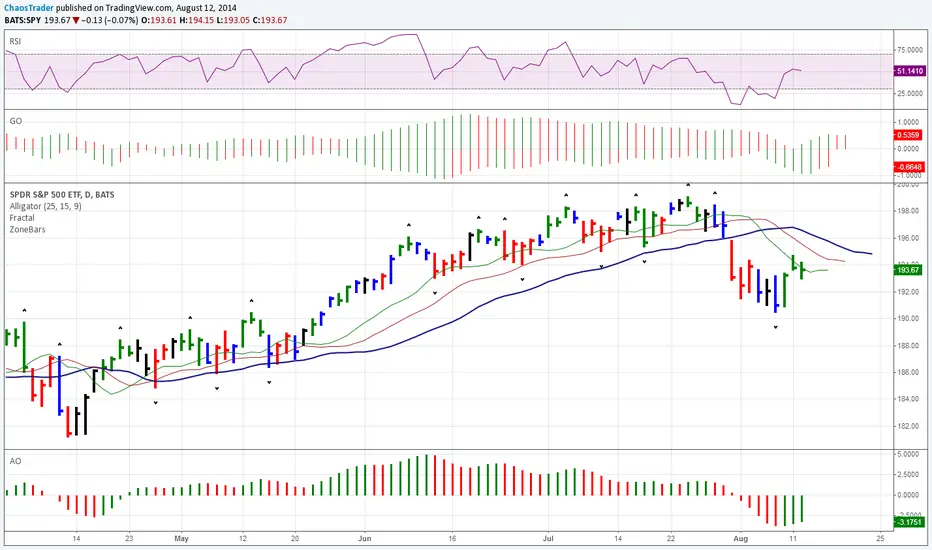
Bill Williams Zone and Squat Bars. See New Trading Dimensions by Bill Williams, PhD.
Bars are green (green zone) when the Awesome Oscillator and Accelerator/Decelerator are both positive.
Bars are red (red zone) when the Awesome Oscillator and Accelerator/Decelerator are both negative.
Bars are blue when a squat bar is formed, these indicate a battle between bulls and bears and often happen near trend continuation or trend changes.
Caution: Assumes chart is a bar chart - not a candle chart.
Caution: Squat bars are accurate only with official exchange volume data - BATS data will give false squat bars.
Script open-source
In pieno spirito TradingView, il creatore di questo script lo ha reso open-source, in modo che i trader possano esaminarlo e verificarne la funzionalità. Complimenti all'autore! Sebbene sia possibile utilizzarlo gratuitamente, ricorda che la ripubblicazione del codice è soggetta al nostro Regolamento.
Declinazione di responsabilità
Le informazioni ed i contenuti pubblicati non costituiscono in alcun modo una sollecitazione ad investire o ad operare nei mercati finanziari. Non sono inoltre fornite o supportate da TradingView. Maggiori dettagli nelle Condizioni d'uso.