@InvInst AT - Probability Panel
📊 OVERVIEW
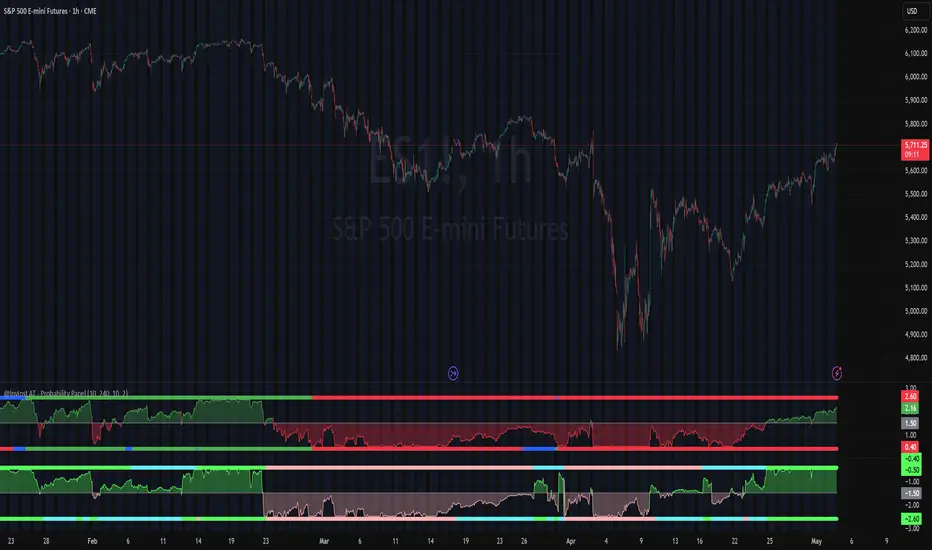
The AT Indicator uses ZGs to evaluate trends through probability-based calculations of bullish, sideways, or bearish outcomes. It works best with the ZG Indicator, which identifies Reversal Zones (ZG), trigger levels, and dynamic Fibonacci retracements across any timeframe and asset, offering an unbiased analysis. The accompanying chart demonstrates the AT Indicator as a below panel.
📊 VALUE OF THE INDICATOR…
No matter if you are a discretionary or a systematic trader, the result of this approach is game changer, since ensuring a single valid interpretation of asset trends, supported by key price and time points (ZG), (1) is crucial for robust analysis; (2) minimizes degrees of freedom for machine learning or AI algorithms applied to market data; (3) helps separate order from noise/chaos in a fully consistent and internally coherent manner.
For discretionary traders, having a single valid interpretation of a trend (1) minimizes emotional fatigue caused by constant reinterpretation and subjective data selection, (2) establishes a foundation for objective pattern recognition, and (3) provides a layer of information such as the real time probability that perfectly complements any other indicator or approach.
📊 FIRST THINGS FIRST: A BIT OF THEORY…
Definition of ZG
A ZG signifies a consolidation or inflection point where the previous trend might conclude. These formations are instrumental in the trend analysis of any asset, irrespective of the asset or timeframe. Formally, we define ZG_tf = (timestamp_zg, price_zg), indicating a ZG is represented as a pair consisting of its timestamp and price within a specified timeframe.
Types of ZGs
We categorize ZGs based on their directional implications:
✅ Bullish Reversal Zone (ZGA) – Regions where prices may rebound upward or consolidate following a downtrend.
✅ Bearish Reversal Zone (ZGB) – Regions where prices may reverse downward after an uptrend.
Furthermore, three distinct statuses are assigned to each ZG:
• Potential ZGs (ZGAPot and ZGBPot on the chart) – Zones anticipated to develop in the future, aiding in forecasting potential future trends.
• Current or Last Identified ZGs – The latest reversal zones detected for each timeframe.
• Confirmed ZGs – Validated zones that serve as static reference points delineating historical trends unequivocally.
📊 FUNCTIONALITY: WHAT IT DOES…
The AT Indicator provides detailed information on trend changes over time, potential future trends based on Potential ZGs, and a visual analysis of trend probabilities in two timeframes. The panel uses colors to represent trend directions: 🟢 green for bullish, 🔴 red for bearish, and 🔵 blue for sideways (color chosen based on feedback from visually impaired users).
The indicator structures the information as follows:
Upper half of the panel refers to the larger timeframe, and provides contextual information in terms of trend and trend probability, while the lower half of the panel corresponds to the chart’s timeframe (usually, the timeframe chosen by the user to trade).
The information for each timeframe is equally structured:
✅ It shows as a footprint the Current Trend for candle-by-candle, in what constitutes a clear and consistent map of the asset’s trip in terms of an objective and continuous trend.
✅ Additionally, it shows the potentially Future Trend using the information coming from Potential ZGs that could be identified next.
✅ The indicator also shows by default, candle-by-candle, the evolution of Net Probabilites —i.e., the difference between the probability of a Bullish trend and of a Bearish trend—. It usually helps the trader understand what the most likely direction is, and if the probability is gaining or losing momentum.
✅ Distribution of Trend Scenarios – The user can choose an alternative representation where the indicator shows in a visual way the probability assigned to either Bullish, Sideways and Bearish trend scenarios.
📊 KEY FEATURES: HOW IT DOES IT…
The AT Indicator is 100% original, devoid of public domain code, and operates independently of changeable parameters for individual assets. The calculation of the probability assigned to each scenario is based on the Euclidean distance of the price and the trigger levels that would alter the trend. Key features include:
🔹100% Objective Approach for the identification of ZGs based on mathematical equation systems.
🔹No Repainting – Use of available information at the time, avoiding reinterpretation of past data.
🔹Early Detection – Since it is a price action indicator, there is no delay in the identification of a change in the trend. The use of highs and lows, instead of ZGs have practical limitations and lagging effects that can also be avoided with ZGs.
🔹Dual Timeframe Analysis – Integrates smaller and larger timeframes for enhanced trend context.
🔹Based on Trend Definition – higher ZGBs and higher ZGAs for bullish trend, lower ZGBs and lower ZGAs for bearish, and all other cases classified as sideways trend.
📊 HOW TO USE IT…
The AT Indicator is 100% self-explanatory, its outcome is directly usable, as it provides an objective identification of the current and future asset’s trends, and the calculation of the probability as an unequivocal representation that any trader can understand right away . It only represents half of our comprehensive trend analysis, since our ZG Indicator complements and augments the AT Indicator's insights, providing historical ZGs as well as next Potential ZGs that could form in the future, and the trigger levels that would alter the trend. The combination of both indicators is recommended.
When the sign (color) of the Net Probabilities are the same in both timeframes, it is when the most directional deep moves take place. This can be used by any trader to determine the most likely direction of the next moves, as well as a simple yet efficient way to filter out non-directional moves.
📊 AVAILABLE SETTINGS
The AT Indicator offers a comprehensive settings window for full control of displayed information:
🔹 Number of ZGs for chart’s timeframe (optimizable for TradingView performance)
🔹 Larger Timeframe Selection (options vary per TradingView plan)
🔹 Number of ZGs for larger timeframes (optimizable for TradingView performance)
🔹 Enable/Disable Net Probablities (when disabled, the indicator shows the distribution of probabilities for each trend scenario)
📊 ADDITIONAL CONSIDERATIONS
As stated before, it only represents half of our comprehensive trend analysis, since our ZG Indicator complements and augments the AT Indicator's insights, providing historical ZGs as well as the next Potential ZGs that could form in the future, and the trigger levels that would alter the trend. The combination of both indicators is recommended.
Recommended timeframe combinations:
🔹 1-minute and 5-minutes - Suitable for scalpers
🔹 5-minutes and 15-minutes - Ideal for scalping and fine-tuning swing trades
🔹 1-hour and 4-hours - Beneficial for swing traders and long-term position adjustments
🔹 1-day and 1-week - Optimal for long-term investors
⚠️ Disclaimer: This indicator does not generate buy or sell signals. It is advised to use it alongside the AT Indicator and integrate it with additional technical analysis tools and risk management strategies.
Script su invito
Solo gli utenti approvati dall'autore possono accedere a questo script. È necessario richiedere e ottenere l'autorizzazione per utilizzarlo. Tale autorizzazione viene solitamente concessa dopo il pagamento. Per ulteriori dettagli, seguire le istruzioni dell'autore riportate di seguito o contattare direttamente Inversores_Institucionales.
TradingView NON consiglia di acquistare o utilizzare uno script a meno che non si abbia piena fiducia nel suo autore e se ne comprenda il funzionamento. È inoltre possibile trovare alternative gratuite e open source nei nostri script della community.
Istruzioni dell'autore
Declinazione di responsabilità
Script su invito
Solo gli utenti approvati dall'autore possono accedere a questo script. È necessario richiedere e ottenere l'autorizzazione per utilizzarlo. Tale autorizzazione viene solitamente concessa dopo il pagamento. Per ulteriori dettagli, seguire le istruzioni dell'autore riportate di seguito o contattare direttamente Inversores_Institucionales.
TradingView NON consiglia di acquistare o utilizzare uno script a meno che non si abbia piena fiducia nel suo autore e se ne comprenda il funzionamento. È inoltre possibile trovare alternative gratuite e open source nei nostri script della community.