PROTECTED SOURCE SCRIPT
Price levels
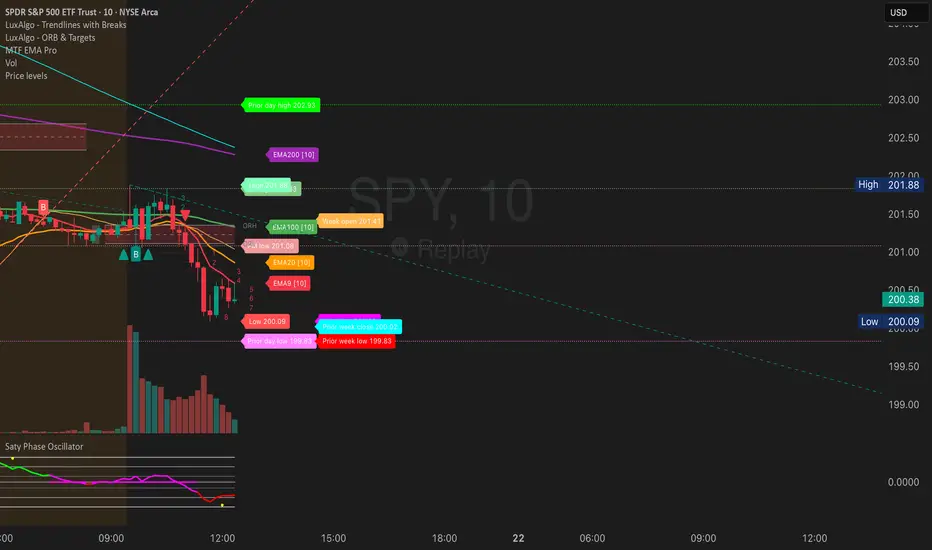
PRICE LEVELS INDICATOR - DESCRIPTION
This TradingView indicator displays critical institutional price levels that professional traders use for intraday decision-making. The indicator automatically plots horizontal lines at key support and resistance levels derived from previous and current trading sessions, along with two simple moving averages for trend context.
KEY FEATURES
Daily Levels:
Prior Day High/Low: Yesterday's trading range extremes
Pre-Market High/Low: The highest and lowest prices reached during pre-market hours (4:00 AM - 9:30 AM EST)
Current Day High/Low/Open: Today's intraday extremes and opening price
After-Hours High/Low: Post-market session price extremes (4:00 PM - 8:00 PM EST)
First Bar High/Low: The high and low of the first regular trading session bar
Weekly Levels:
Prior Week High/Low/Close: Last week's price extremes and closing price
Current Week High/Low/Open: This week's ongoing price range and opening level
Moving Averages:
SMA 20 (default): Short-term trend indicator
SMA 200 (default): Long-term trend indicator
HOW TO USE THIS INDICATOR
Installation:
Copy the entire Pine Script code
In TradingView, open the Pine Editor (bottom panel)
Paste the code and click "Add to Chart"
The indicator will overlay directly on your price chart
Configuration:
All settings are accessible through the indicator settings menu (gear icon). You can customize:
Which price levels to display (toggle each level on/off)
Line colors, thickness, and styles (solid, dashed, dotted)
Label display and positioning
Price axis visibility for each level
Label text content and colors
Best Practices for Trading:
Market Structure:
Price above Week Open = bullish bias
Price below Week Open = bearish bias
Use Prior Week Close as major support/resistance
Entry Timing:
Look for bounces off Prior Day High/Low
Pre-Market High/Low often act as breakout triggers
Institutional traders watch these levels closely
Risk Management:
Place stops below/above relevant price levels
Prior Day Low often serves as stop-loss for longs
Prior Day High often serves as stop-loss for shorts
Confluence Trading:
Strongest setups occur when multiple levels align
Example: Price bounces at both Prior Day Low AND Week Open
Combine with moving averages for additional confirmation
Breakout Trading:
Pre-Market High break = potential bullish momentum
Pre-Market Low break = potential bearish momentum
Prior Week High break = strong bullish signal
Prior Week Low break = strong bearish signal
RECOMMENDED SETTINGS
For Day Trading:
Enable: Prior Day High/Low, PM High/Low, Week Open, Prior Week Close
Timeframe: 5-minute or 15-minute charts
Display: "Most recent level on most recent day"
For Swing Trading:
Enable: Prior Week High/Low, Current Week High/Low, Week Open
Timeframe: 1-hour or 4-hour charts
Display: "Most recent level across the chart"
For Scalping:
Enable: PM High/Low, Current Day High/Low
Timeframe: 1-minute or 3-minute charts
Disable weekly levels to reduce clutter
ALERT SETUP
The indicator includes built-in alerts for:
Price crossing above Pre-Market High
Price crossing below Pre-Market Low
Price closing above Pre-Market High
Price closing below Pre-Market Low
To enable alerts:
Right-click on the indicator name
Select "Add Alert"
Choose the desired alert condition
Set alert frequency and notification method
UNDERSTANDING LABEL COLORS
Each price level has a distinct color scheme by default:
Green tones: High levels (resistance)
Red/Pink tones: Low levels (support)
Yellow/Orange: Opening prices
Cyan/Blue: Weekly levels
All colors are fully customizable in the settings to match your chart theme.
TECHNICAL NOTES
The indicator only displays on intraday timeframes (seconds, minutes, hours)
It does not work on daily, weekly, or monthly charts
Lines automatically extend to the current bar
Labels update in real-time as prices move
Pre-market and after-hours levels require extended trading session data enabled in your chart settings
COMMON USE CASES
Gap Trading: Use Pre-Market High/Low to identify gap fill targets
Range Trading: Trade bounces between Prior Day High and Low
Breakout Trading: Enter when price decisively breaks key levels
Trend Following: Combine price levels with SMA 20 and 200 for trend confirmation
Support/Resistance: Use levels as dynamic support/resistance zones
This indicator is designed to give traders immediate visual reference to the price levels that institutional traders and market makers are watching, helping you make informed trading decisions based on areas where significant buying or selling pressure is likely to occur.
Script protetto
Questo script è pubblicato come codice protetto. Tuttavia, è possibile utilizzarle liberamente e senza alcuna limitazione – ulteriori informazioni qui.
Declinazione di responsabilità
Le informazioni e le pubblicazioni non sono intese come, e non costituiscono, consulenza o raccomandazioni finanziarie, di investimento, di trading o di altro tipo fornite o approvate da TradingView. Per ulteriori informazioni, consultare i Termini di utilizzo.