rmwaddelljr

Candlestick Patterns With EMA


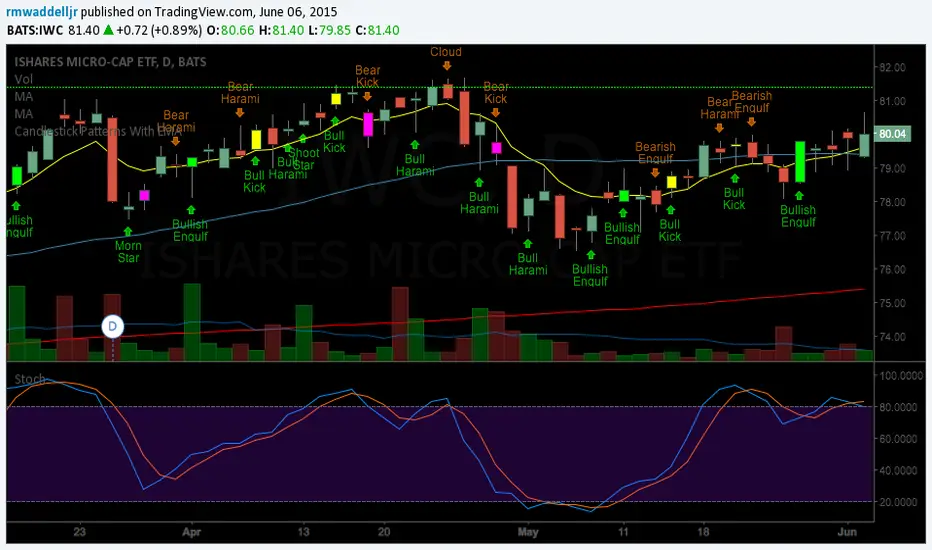
Thanks to repo32 as I embellished on his script "Candlestick patterns Identified" I also copied code ideas from DavidR
and Chris Moody. I have huge respect for you guys who publish script with such ease. My coding is a work in progress.
This script still needs improving. So let me know if you have suggestions.

The whole idea was to present these patterns in context of Steve Bigalow's work. I hope it helps in some way.
Script open-source

Nello spirito di condivisione promosso da TradingView, l'autore (al quale vanno i nostri ringraziamenti) ha deciso di pubblicare questo script in modalità open-source, così che chiunque possa comprenderlo e testarlo. Puoi utilizzarlo gratuitamente, ma il riutilizzo del codice è subordinato al rispetto del Regolamento. Per aggiungerlo al grafico, mettilo tra i preferiti.

Declinazione di responsabilità

Le informazioni ed i contenuti pubblicati non costituiscono in alcun modo una sollecitazione ad investire o ad operare nei mercati finanziari. Non sono inoltre fornite o supportate da TradingView. Maggiori dettagli nelle Condizioni d'uso.

Vuoi usare questo script sui tuoi grafici?
//Created by Robert Waddell with special thanks to repo32 for his cndlestick ID code, DavidR for EMA code and Chris Moody for barcolor code.
//6/5/15
//Candlestick analysis with buy signals
//If a Bullish candelstick signal is confirmed by a close above the 8 EMA, a buy signal is generated.
//If a Bearish candlestick signal is confirmed by a close below the 8 EMA, a sell signal is generated.
//Candlestick patterns are identified above or below the price action.
study(title ="Candlestick Patterns With EMA", overlay = true)
shb = input(false, title="Show Highlight Bar if close above/below TLine")


TLineEMA = input(8, minval=1, title="Trigger Line")
TLine = ema(close, TLineEMA)


ms = (close[2] < open[2] and max(open[1], close[1]) < close[2] and open > max(open[1], close[1]) and close > open )
plotshape(ms,  title= "Morning Star", location=location.belowbar, color=lime, style=shape.arrowup, offset=-1, text="Morn\nStar")


ss = (open[1] < close[1] and open > close[1] and high - max(open, close) >= abs(open - close) * 3 and min(close, open) - low <= abs(open - close))
plotshape(ss, title= "Shooting Star", location=location.belowbar, color=lime, style=shape.arrowup, text= "Shoot\nStar")


beh = (close[1] > open[1] and open > close and open <= close[1] and open[1] <= close and open - close < close[1] - open[1] )
plotshape(beh, title= "Bearish Harami",  color=orange, style=shape.arrowdown, text="Bear\nHarami")

blh = (open[1] > close[1] and close > open and close <= open[1] and close[1] <= open and close - open < open[1] - close[1] )
plotshape(blh,  title= "Bullish Harami", location=location.belowbar, color=lime, style=shape.arrowup, text="Bull\nHarami")

bee = (close[1] > open[1] and open > close and open >= close[1] and open[1] >= close and open - close > close[1] - open[1] )
plotshape(bee,  title= "Bearish Engulfing", color=orange, style=shape.arrowdown, text="Bearish\nEngulf")

ble = (open[1] > close[1] and close > open and close >= open[1] and close[1] >= open and close - open > open[1] - close[1] )
plotshape(ble, title= "Bullish Engulfing", location=location.belowbar, color=lime, style=shape.arrowup, text="Bullish\nEngulf")

upper = highest(10)[1]
ps = (close[1] < open[1] and  open < low[1] and close > close[1] + ((open[1] - close[1])/2) and close < open[1])
plotshape(ps, title= "Piercing Line", location=location.belowbar, color=lime, style=shape.arrowup, text="Pierc\nSig")

blk = (open[1]>close[1] and open>=open[1] and close>open)
plotshape(blk, title= "Bullish Kicker", location=location.belowbar, color=lime, style=shape.arrowup, text="Bull\nKick")


bek = (open[1]<close[1] and open<=open[1] and close<=open)
plotshape(bek, title= "Bearish Kicker", color=orange, style=shape.arrowdown, text="Bear\nKick")


dcc = ((close[1]>open[1])and(((close[1]+open[1])/2)>close)and(open>close)and(open>close[1])and(close>open[1])and((open-close)/(.001+(high-low))>0.6))
plotshape(dcc, title= "Dark Cloud Cover", color=orange, style=shape.arrowdown, text="Dark\nCloud")

plot(TLine, color=yellow, title="T-Line EMA", linewidth=1)

aboveTLine = close > TLine ? 1 : 0
belowTLine = close < TLine ? 1 : 0


barcolor(ms and belowTLine ? fuchsia : na)  
barcolor(bek and belowTLine ? fuchsia : na)
barcolor(ps and aboveTLine ? lime : na)
barcolor(blk and aboveTLine ? yellow : na)
barcolor(ble and aboveTLine ? lime : na)