OPEN-SOURCE SCRIPT
Aggiornato Dynamic Laguerre Filter Bands | Otto
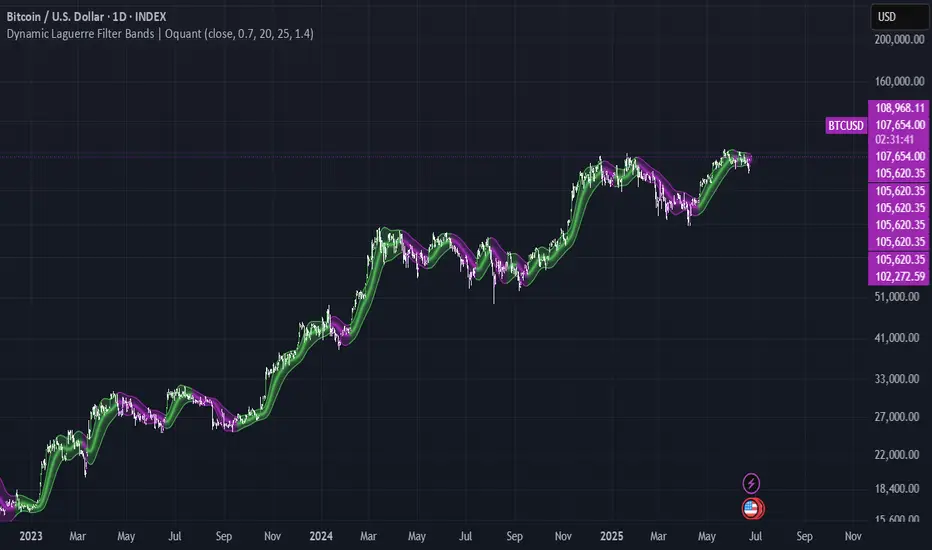
This indicator combines trend-following and volatility analysis by enhancing the traditional Laguerre filter with a dynamic, volatility-adjusted band system. Instead of using fixed thresholds, the bands adapt in real-time to changing market conditions by applying smoothed standard deviation calculations. This design keeps the indicator responsive to significant price movements while effectively filtering out short-term market noise, resulting in more accurate trend identification and breakout signals.
Core Concept
The indicator is built around the following key components:
Laguerre Filter:
The Laguerre filter is designed to smooth out price data by reducing market noise while still being quick enough to detect real changes in price direction. Its goal is to create a clear, smooth trend line that helps traders/investors focus on the overall market trend without getting distracted by small, random price swings.
It uses a parameter called gamma to control how it balances smoothness and responsiveness:
A lower gamma gives more weight to recent price data, making the filter react faster to new price changes. This means the trend line is more sensitive but may also be less smooth and more prone to small fluctuations.
A higher gamma gives more weight to past price data, making the filter smoother and less sensitive to quick changes. This helps reduce noise and produces a steadier trend line, but it also introduces more lag, meaning the filter reacts slower to new price moves.
By adjusting gamma, the Laguerre filter lets you choose the balance between following price changes quickly and having a stable, noise-free trend signal.
Standard Deviation:
shows how much price varies from the mean. In this indicator, it’s used to measure market volatility.
Volatility Bands: The upper and lower bands are based on an EMA-smoothed standard deviation of price. The EMA reduces sudden jumps in volatility, creating smoother and more stable bands that still respond to changing market conditions. These bands are plotted around the Laguerre filter line, expanding and contracting in a controlled way to stay aligned with real market movement while avoiding short-term noise.
Signal Logic:
A long signal is triggered when the close price crosses above the upper band.
A short signal occurs when the close price falls below the lower band.
⚙️ Inputs
Source: Price source used in calculations
Gamma: Adjusts how much the Laguerre filter responds to price changes. Lower gamma values make the filter react more to recent prices, while higher values give more influence to older data, making the line smoother but slower to respond.
Volatility Length: Period used to calculate standard deviation
Volatility Smoothing Length: EMA smoothing length for standard deviation
Multiplier: Scales the width of the bands based on volatility
📈 Visual Output
Laguerre Filter Line: Plots the laguerre filter line, colored dynamically based on signal direction (green for bullish, purple for bearish)
Upper & Lower Bands: Volatility-based bands that adjust with market conditions. (green for bullish, purple for bearish)
Glow Effect: Optional glow layer to enhance visibility of the laguerre filter trend line (green for bullish, purple for bearish)
Bar Coloring: Candlesticks and bar colors reflect the active signal state for fast visual interpretation (green for bullish, purple for bearish)
How to Use
Apply the indicator to your chart and monitor for signal events:
Long Signal: When price closes above the upper band
Short Signal: When price closes below the lower band
🔔 Alerts
This indicator supports optional alert conditions you can enable for:
Long Signal: Close price crossing above the upper band
Short Signal: Close price crossing below the lower band
⚠️ Disclaimer:
This indicator is intended for educational and informational purposes only. Trading/investing involves risk, and past performance does not guarantee future results. Always test and evaluate indicators/strategies before applying them in live markets. Use at your own risk.
Note di rilascio
Updated indicator titleScript open-source
Nello spirito di TradingView, l'autore di questo script lo ha reso open source, in modo che i trader possano esaminarne e verificarne la funzionalità. Complimenti all'autore! Sebbene sia possibile utilizzarlo gratuitamente, ricordiamo che la ripubblicazione del codice è soggetta al nostro Regolamento.
Get access to my premium indicators and strategies.
oquantsystems.com/
oquantsystems.com/
Declinazione di responsabilità
Le informazioni e le pubblicazioni non sono intese come, e non costituiscono, consulenza o raccomandazioni finanziarie, di investimento, di trading o di altro tipo fornite o approvate da TradingView. Per ulteriori informazioni, consultare i Termini di utilizzo.
Script open-source
Nello spirito di TradingView, l'autore di questo script lo ha reso open source, in modo che i trader possano esaminarne e verificarne la funzionalità. Complimenti all'autore! Sebbene sia possibile utilizzarlo gratuitamente, ricordiamo che la ripubblicazione del codice è soggetta al nostro Regolamento.
Get access to my premium indicators and strategies.
oquantsystems.com/
oquantsystems.com/
Declinazione di responsabilità
Le informazioni e le pubblicazioni non sono intese come, e non costituiscono, consulenza o raccomandazioni finanziarie, di investimento, di trading o di altro tipo fornite o approvate da TradingView. Per ulteriori informazioni, consultare i Termini di utilizzo.