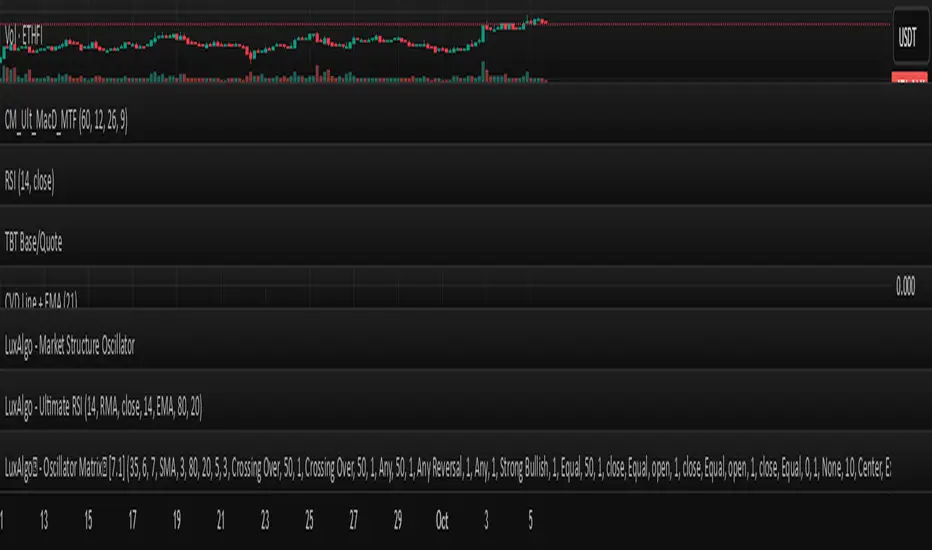
This indicator visualizes the Cumulative Volume Delta (CVD) as a line and overlays an Exponential Moving Average (EMA, default length 21) on the CVD. The CVD estimates buy/sell volume using candle direction, accumulating volume when price moves up or down. The EMA helps smooth the CVD, quickly signaling directional shifts that can indicate potential trend changes. The line turns green when CVD holds above its EMA (suggesting bullish pressure) and red when below (suggesting bearish pressure).
Settings allow users to customize the EMA period to suit different timeframes or trading strategies. The script is intended for educational purposes and is released under the Mozilla Public License 2.0. For best results, use in conjunction with other analysis and risk management tools.
Script su invito
Solo gli utenti approvati dall'autore possono accedere a questo script. È necessario richiedere e ottenere l'autorizzazione per utilizzarlo. Tale autorizzazione viene solitamente concessa dopo il pagamento. Per ulteriori dettagli, seguire le istruzioni dell'autore riportate di seguito o contattare direttamente MFH_BM.
TradingView NON consiglia di pagare o utilizzare uno script a meno che non ci si fidi pienamente del suo autore e non si comprenda il suo funzionamento. Puoi anche trovare alternative gratuite e open-source nei nostri script della comunità.
Istruzioni dell'autore
This indicator plots the Cumulative Volume Delta (CVD) and overlays an adjustable Exponential Moving Average (EMA, default length 21) on it.
Adjust the EMA length in the settings as needed for your timeframe or asset.
Attenzione: prima di richiedere l'accesso, leggi la nostra guida per gli script su invito.
Le informazioni ed i contenuti pubblicati non costituiscono in alcun modo una sollecitazione ad investire o ad operare nei mercati finanziari. Non sono inoltre fornite o supportate da TradingView. Maggiori dettagli nelle Condizioni d'uso.