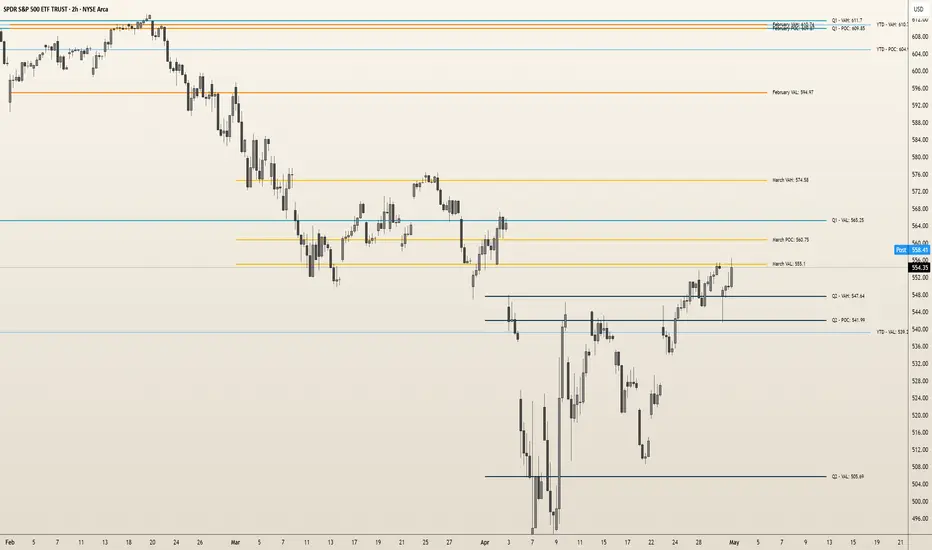
Teddy

"Teddy" is an indicator that overlays up to five customizable Volume Profiles on the chart, each displaying Point of Control (POC), Value Area High (VAH), and Value Area Low (VAL). Designed for traders, it anchors profiles to user-defined time ranges, helping align traders with the ever changing auction so they are on the right side of trends, avoid choppy price action, and stay clear of overbought/oversold conditions.
Originality and Usefulness
Unlike standard Volume Profile tools, "Teddy" offers five independent profiles with flexible anchored or fixed time ranges, customizable labels, and distinct colors. This multi-profile approach reveals key price levels across different periods, enabling traders to navigate trends and avoid low-opportunity zones effectively, ideal for equities, futures, or indices.
What It Does
Plots up to five Volume Profiles, each with POC, VAH, and VAL lines.
Labels levels with customizable prefixes and price displays.
Supports anchored (start-to-present) or fixed (start-to-stop) time ranges, adjustable via inputs or chart dragging.
How It Works
Data Sources: Uses lower timeframe data (e.g., 1-minute on a 5-minute chart) to build volume distributions.
Calculations:
POC: Identifies the price with the highest traded volume in the selected range.
VAH/VAL: Defines the value area (default: 70% of volume(recommended)) around POC.
Time Ranges: Each profile starts at a user-set time, extending to the present or a stop time if fixed.
Visualization: Draws lines and labels for POC, VAH, and VAL, with customizable colors, offsets, and leftward extensions.
How It Helps Traders
"Teddy" aligns traders with the auction to help avoids pitfalls:
Staying with the Trend: Price above POC Indicates buyers are in control of the profile being studied which allows the auction to move towards VAH next. Price below POC Indicates sellers are in control of the profile being studied which allows the auction to move towards VAL next. guiding trend-following entries. Breakouts above VAH can signal an expansion opportunity for price and breakdowns below VAL can signal an expansion opportunity for price.
Avoiding Choppy Conditions: POC acts as a price anchor(magnet almost) that draws price towards it due to the high volume around this pivot— Price oscillating around POC often indicates consolidation(almost a battle between buyers and sellers); Its wise to let the battle finish to understand the true direction. Teddy also helps traders identify consolidation between ranges as buyers and sellers fight for acceptance above below in inside of one or multiple ranges. This type of structure between ranges often brings chop with it as well.
Steering Clear of Overbought/Oversold: Extreme price moves far from POC or VAH/VAL, especially in recent profiles, suggest price at premium or price at discount. This can help traders avoid chasing an extended move to the upside or the downside.
Multiple profiles provide temporal context, ensuring trades align with multiple auctions to define price at a value, at a discount or at a premium and not just fleeting noise.
How to Use It
Apply to any chart (e.g., ES 1H for futures).
Customize via inputs:
"Profile [1-5] Settings": Enable/disable, set start/stop times, toggle fixed range.
"Profile [1-5] Appearance": Adjust horizontal offset for labels.
"Profile [1-5] Colors": Set POC, VAH, VAL colors (e.g., yellow, blue).
"Profile [1-5] POC & Value Area": Adjust value area percentage (default: 70%), toggle POC/VAH/VAL display, extend lines left.
"Profile [1-5] Label Customization": Set label prefixes, show prices, and text colors.
Underlying Concepts
Volume Profile: POC and VAH/VAL highlight high-volume acceptance zones, anchoring trend analysis.
Temporal Analysis: Multiple profiles reveal evolving market structure over user-defined periods.
Limitations
May require a Premium Trading view plan due to data being pulled on lower time frames such as the 1 minute. Check to ensure your plan meets these requirements.
Profiles looking back multiple months (e.g., 9 or 12 months) on lower timeframes (e.g., 1-minute) may cause memory errors or fail to load due to data limits.
Hourly or higher timeframes are best for accurate data on extended lookbacks, especially in futures markets.
Accuracy depends on lower timeframe data availability.
Levels are contextual, not guaranteed signals.
- Automated Previous Month range of value
- Automated Previous Current Month of value
- Automated Year to date range of value
- Automated Rolling 12 month range of value
- Left one value range for manual input
- Added PW High and Low
Some visual label improvements added as well.
Script su invito
Solo gli utenti approvati dall'autore possono accedere a questo script. È necessario richiedere e ottenere l'autorizzazione per utilizzarlo. Tale autorizzazione viene solitamente concessa dopo il pagamento. Per ulteriori dettagli, seguire le istruzioni dell'autore riportate di seguito o contattare direttamente ATMTrades.
TradingView NON consiglia di acquistare o utilizzare uno script a meno che non si abbia piena fiducia nel suo autore e se ne comprenda il funzionamento. È inoltre possibile trovare alternative gratuite e open source nei nostri script della community.
Istruzioni dell'autore
Declinazione di responsabilità
Script su invito
Solo gli utenti approvati dall'autore possono accedere a questo script. È necessario richiedere e ottenere l'autorizzazione per utilizzarlo. Tale autorizzazione viene solitamente concessa dopo il pagamento. Per ulteriori dettagli, seguire le istruzioni dell'autore riportate di seguito o contattare direttamente ATMTrades.
TradingView NON consiglia di acquistare o utilizzare uno script a meno che non si abbia piena fiducia nel suo autore e se ne comprenda il funzionamento. È inoltre possibile trovare alternative gratuite e open source nei nostri script della community.