LT Pro-Divergence 2.0
It is possible for a divergence to be “negated” – which happens when price continues to move in its direction (i.e. in the direction of the major trend) despite a divergence. So often price can negate a divergence (e.g. a bullish or bearish divergence). This can happen quite a lot in strong trends with momentum.
Due to the numerous divergences that can occur on charts (often with many false signals or whipsaws) – it can be better to use divergence in combination with other technical analysis methods to increase the probabilities. For example, combining divergence with other trend reversal chart techniques such as: trendline breaks, moving average crossovers, break of support or resistance, or oscillators like MACD or RSI etc.
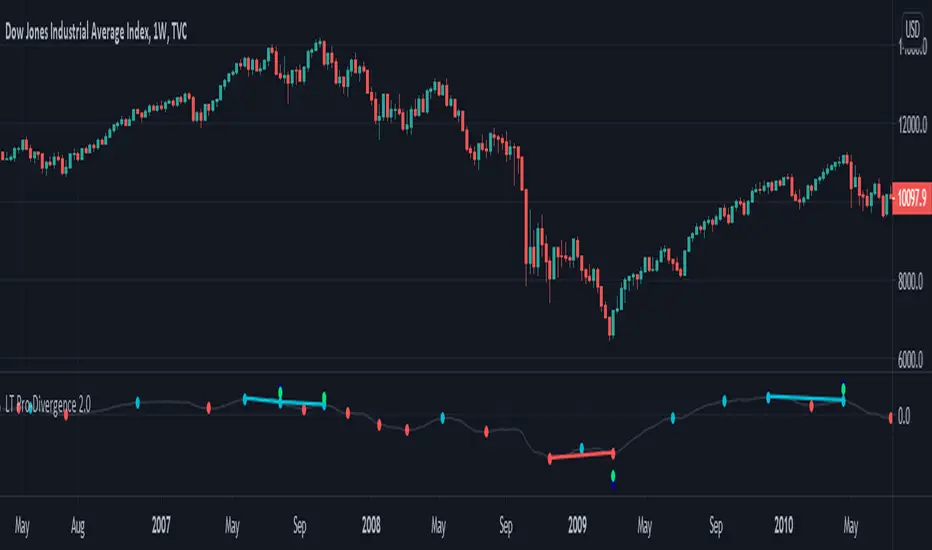
The red divergence colour can indicate a potential bullish divergence, blue divergence colour can indicate a potential bearish divergence. The indicator can also warn of potential divergences developing – so a magenta warning can indicate a potential bullish divergence and a yellow/orange warning of a potential bearish divergence.
The pro divergence indicator incorporates green and blue dots to show when RSI and stochastics is oversold or overbought. The RSI overbought/oversold is shown as dark blue dots – and the stochastics overbought/oversold is shown as green dots. This is added as an extra feature to add further information to the divergence signal. The momentum used in the indicator is the MACD.
The indicator can be used on the charts of the majority of markets (e.g. stocks, indices, ETFs, currencies, cryptocurrencies, precious metals, commodities etc.) and any timeframe. It should be noted that the degree of noise and randomness increases significantly on lower timeframes. So the lower the timeframe that is chosen (e.g. 15-min or lower) the greater the degree of noise and randomness and therefore the higher the frequency of false signals or whipsaws.
Chartists should be aware of the probabilistic and uncertain nature of price action and the markets, and therefore prepare to limit and control any potential risks.
If you would like access, please send me a PM on Tradingview.
Script su invito
Solo gli utenti approvati dall'autore possono accedere a questo script. È necessario richiedere e ottenere l'autorizzazione per utilizzarlo. Tale autorizzazione viene solitamente concessa dopo il pagamento. Per ulteriori dettagli, seguire le istruzioni dell'autore riportate di seguito o contattare direttamente LeadingTrader.
TradingView NON consiglia di acquistare o utilizzare uno script a meno che non si abbia piena fiducia nel suo autore e se ne comprenda il funzionamento. È inoltre possibile trovare alternative gratuite e open source nei nostri script della community.
Istruzioni dell'autore
You may also email: support@leadingtrader.com
Declinazione di responsabilità
Script su invito
Solo gli utenti approvati dall'autore possono accedere a questo script. È necessario richiedere e ottenere l'autorizzazione per utilizzarlo. Tale autorizzazione viene solitamente concessa dopo il pagamento. Per ulteriori dettagli, seguire le istruzioni dell'autore riportate di seguito o contattare direttamente LeadingTrader.
TradingView NON consiglia di acquistare o utilizzare uno script a meno che non si abbia piena fiducia nel suo autore e se ne comprenda il funzionamento. È inoltre possibile trovare alternative gratuite e open source nei nostri script della community.
Istruzioni dell'autore
You may also email: support@leadingtrader.com