PROTECTED SOURCE SCRIPT
Shadow Edge
Shadow Edge Indicator
Overview
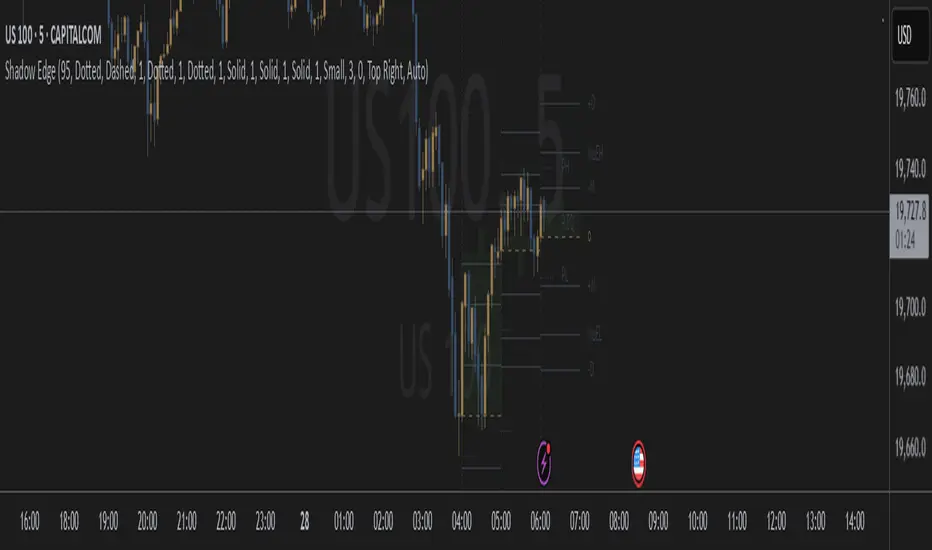
Shadow Edge is an advanced technical analysis tool that visualizes key price levels and statistical patterns based on multiple timeframe analysis. It helps traders identify potential support, resistance, and expansion zones by tracking historical price behavior at specific hours of the trading day.
This indicator offers unique statistical insights by calculating average expansion levels and tracking market behavior patterns on an hourly basis. Unlike standard technical indicators, Shadow Edge combines historical price analysis with proprietary statistical calculations to identify high-probability zones for market reactions.
Key Features
• Previous High/Low Visualization: Displays previous session high and low levels with configurable line styles
• Mean Expansion Levels: Calculates and displays average price expansion levels (MuEH/MuEL) based on historical data
• Manipulation/Distribution Levels: Shows potential manipulation and distribution zones calculated from price action patterns
• Sweep Detection: Alerts when price sweeps previous high or low levels with customizable offset
• Multi-timeframe Analysis: Analyzes higher timeframe data and projects it onto your current chart
• Statistical Tracking: Maintains a database of price behavior by hour to identify recurring patterns
• Fully Customizable Visuals: Adjust colors, line styles, and transparency to match your chart setup
Settings
• Customize appearance of all elements including candles, lines, and labels
• Toggle visibility of different price levels
• Set alert conditions for level tests and sweeps
• Configure historical bar lookback period
• Optional stats display showing reliability percentages by hour
Use Cases
• Identify potential reversal zones at previous highs/lows
• Anticipate likely price expansion based on statistical averages
• Recognize manipulation and distribution patterns in price action
• Set precise alerts for sweep events at key levels
• Enhance your trading strategy with multi-timeframe analysis
How to Use It
1. Initial Setup: Apply the indicator to your chart and configure the higher timeframe setting (default is 60 min) to match your trading style.
2. Level Identification:
• Previous High (PH) and Previous Low (PL) levels show where price previously found support/resistance
• Mean Expansion High (MuEH) and Low (MuEL) levels indicate statistically likely price boundaries
• The Previous EQ level represents the equilibrium point between previous high and low
3. Trading Strategy Applications:
• Look for price reactions when testing previous high/low levels
• Use expansion levels (MuEH/MuEL) as potential take-profit targets
• Monitor manipulation (-M, +M) and distribution (-D, +D) levels for potential reversal zones
• Set alerts for sweeps of previous high/low levels to identify potential stop hunts
4. Statistical Analysis:
• The optional stats table shows reliability percentages for different hours
• Higher percentages indicate historically stronger adherence to the projected levels
• Use this data to adjust your trade timing and risk management
5. Visual Customization:
• Adjust colors and line styles to create a clean, easy-to-read chart
• Toggle different elements on/off based on your specific trading approach
• Reduce transparency settings if you prefer a more subtle visual overlay
Important Notes
• This indicator uses statistical calculations to identify price levels; past performance does not guarantee future results
• For best results, use on liquid markets during their primary trading sessions
• While the indicator provides statistical projections, always combine these signals with your own analysis and risk management strategy
• The code containing the proprietary algorithms is protected as closed source to maintain its integrity
Limitations
• The indicator requires sufficient historical data to calculate accurate statistical levels
• Performance may vary depending on market volatility and trading conditions
• Level projections work best on standard chart types (not Heikin Ashi, Renko, etc.)
• Sweep detections should be confirmed with price action before taking action
Note: Contact me for a version of this indicator that can work on any Higher Timeframe.
Overview
Shadow Edge is an advanced technical analysis tool that visualizes key price levels and statistical patterns based on multiple timeframe analysis. It helps traders identify potential support, resistance, and expansion zones by tracking historical price behavior at specific hours of the trading day.
This indicator offers unique statistical insights by calculating average expansion levels and tracking market behavior patterns on an hourly basis. Unlike standard technical indicators, Shadow Edge combines historical price analysis with proprietary statistical calculations to identify high-probability zones for market reactions.
Key Features
• Previous High/Low Visualization: Displays previous session high and low levels with configurable line styles
• Mean Expansion Levels: Calculates and displays average price expansion levels (MuEH/MuEL) based on historical data
• Manipulation/Distribution Levels: Shows potential manipulation and distribution zones calculated from price action patterns
• Sweep Detection: Alerts when price sweeps previous high or low levels with customizable offset
• Multi-timeframe Analysis: Analyzes higher timeframe data and projects it onto your current chart
• Statistical Tracking: Maintains a database of price behavior by hour to identify recurring patterns
• Fully Customizable Visuals: Adjust colors, line styles, and transparency to match your chart setup
Settings
• Customize appearance of all elements including candles, lines, and labels
• Toggle visibility of different price levels
• Set alert conditions for level tests and sweeps
• Configure historical bar lookback period
• Optional stats display showing reliability percentages by hour
Use Cases
• Identify potential reversal zones at previous highs/lows
• Anticipate likely price expansion based on statistical averages
• Recognize manipulation and distribution patterns in price action
• Set precise alerts for sweep events at key levels
• Enhance your trading strategy with multi-timeframe analysis
How to Use It
1. Initial Setup: Apply the indicator to your chart and configure the higher timeframe setting (default is 60 min) to match your trading style.
2. Level Identification:
• Previous High (PH) and Previous Low (PL) levels show where price previously found support/resistance
• Mean Expansion High (MuEH) and Low (MuEL) levels indicate statistically likely price boundaries
• The Previous EQ level represents the equilibrium point between previous high and low
3. Trading Strategy Applications:
• Look for price reactions when testing previous high/low levels
• Use expansion levels (MuEH/MuEL) as potential take-profit targets
• Monitor manipulation (-M, +M) and distribution (-D, +D) levels for potential reversal zones
• Set alerts for sweeps of previous high/low levels to identify potential stop hunts
4. Statistical Analysis:
• The optional stats table shows reliability percentages for different hours
• Higher percentages indicate historically stronger adherence to the projected levels
• Use this data to adjust your trade timing and risk management
5. Visual Customization:
• Adjust colors and line styles to create a clean, easy-to-read chart
• Toggle different elements on/off based on your specific trading approach
• Reduce transparency settings if you prefer a more subtle visual overlay
Important Notes
• This indicator uses statistical calculations to identify price levels; past performance does not guarantee future results
• For best results, use on liquid markets during their primary trading sessions
• While the indicator provides statistical projections, always combine these signals with your own analysis and risk management strategy
• The code containing the proprietary algorithms is protected as closed source to maintain its integrity
Limitations
• The indicator requires sufficient historical data to calculate accurate statistical levels
• Performance may vary depending on market volatility and trading conditions
• Level projections work best on standard chart types (not Heikin Ashi, Renko, etc.)
• Sweep detections should be confirmed with price action before taking action
Note: Contact me for a version of this indicator that can work on any Higher Timeframe.
Script protetto
Questo script è pubblicato come codice protetto. Tuttavia, è possibile utilizzarle liberamente e senza alcuna limitazione – ulteriori informazioni qui.
Declinazione di responsabilità
Le informazioni e le pubblicazioni non sono intese come, e non costituiscono, consulenza o raccomandazioni finanziarie, di investimento, di trading o di altro tipo fornite o approvate da TradingView. Per ulteriori informazioni, consultare i Termini di utilizzo.