PROTECTED SOURCE SCRIPT
Aggiornato [EAK]Median Growth% Hist. Vs Estimate
=Indicator "[EAK] Growth rate (Hist.VS Est.)" ซึ่งใช้แสดงอัตราการเติบโตของของบริษัท โดยเปรียบเทียบระหว่างข้อมูลในอดีต (Historical) กับการประมาณการ (Estimate) การตั้งค่าต่างๆ มีดังนี้
Inputs (ข้อมูลนำเข้า): ส่วนนี้ใช้กำหนดรายละเอียดของข้อมูลที่นำมาคำนวณ
-Period (ช่วงเวลา): เลือกช่วงเวลาที่ต้องการวิเคราะห์ เช่น TTM (Trailing Twelve Months) คือ 12 เดือนล่าสุด หรือ FY ที่ใช้ข้อมูลของปีล่าสุด
-Show EPS Growth% (แสดง % การเติบโตทบต้นของ EPS): เลือกให้แสดงเปอร์เซ็นต์การเติบโตเฉลี่ยทบต้นของ EPS
-Show Median Growth% (แสดง % การเติบโตมัธยฐาน): เลือกให้แสดงมัธยฐานของการเติบโตเฉลี่ยทบต้น
-Show EPS Estimate by TradingView (แสดงการประมาณการ EPS โดย TradingView): แสดงข้อมูลการประมาณการ EPS จาก TradingView(เป็นการเรียกข้อมูลล่าสุดที่มีในเทรดดิ้งวิว ดังนั้นโปรดตรวจสอบ ว่าเป็นข้อมูลของปีไหน)
-Position (ตำแหน่ง): กำหนดตำแหน่งการแสดงผลของ Indicator บนหน้าจอ เช่น middle_rigth... (กลาง_ขวา)
-Text Size (ขนาดตัวอักษร): กำหนดขนาดตัวอักษรของข้อมูลที่แสดง เช่น normal (ปกติ)

โดยสรุป Indicator นี้ช่วยให้เห็นภาพรวมของการเติบโตของกำไรบริษัท โดยเปรียบเทียบอดีตกับการคาดการณ์ ทำให้วิเคราะห์แนวโน้มและตัดสินใจลงทุนได้ง่ายขึ้น และการตั้งค่าต่างๆ ช่วยให้ปรับแต่งการแสดงผลให้เหมาะสมกับการใช้งานของผู้ใช้
หมายเหตุ
EPSm=EPS CAGR(Median)
REVm=Revenue CAGR(Median)
OPm=Operating income CAGR(Median)
DIVm=Dividend CAGR(Median)
EQm=Total Equity CAGR(Median)
ASm=Total Asset CAGR(Median)
***Indicatorนี้ ออกแบบมาใช้กับ กราฟDay1 เท่านั้น โดยใช้การเรียกข้อมูลด้วยการนับBarย้อนหลัง อาจมีการผิดพลาดได้บ้าง ดังนั้นหากต้องการความแม่นยำที่สูงโปรดตรวจสอบข้อมูลกับแหล่งข้อมูลที่น่าเชื่อถืออีกครั้ง***
/////////////////////////////////////////////////////////////////////////////////////////
Indicator "[EAK] Growth rate (Hist.VS Est.)" is designed to display a company's growth rate by comparing historical data with estimates. The configuration options are as follows:
Inputs:
Period: Select the analysis period, such as TTM (Trailing Twelve Months), representing the last 12 months, or FY, which uses last full year data.
Show EPS Growth%: Enables the display of the compound annual growth rate (CAGR) of EPS.
Show Median Growth%: Enables the display of the median of the compound annual growth rate.
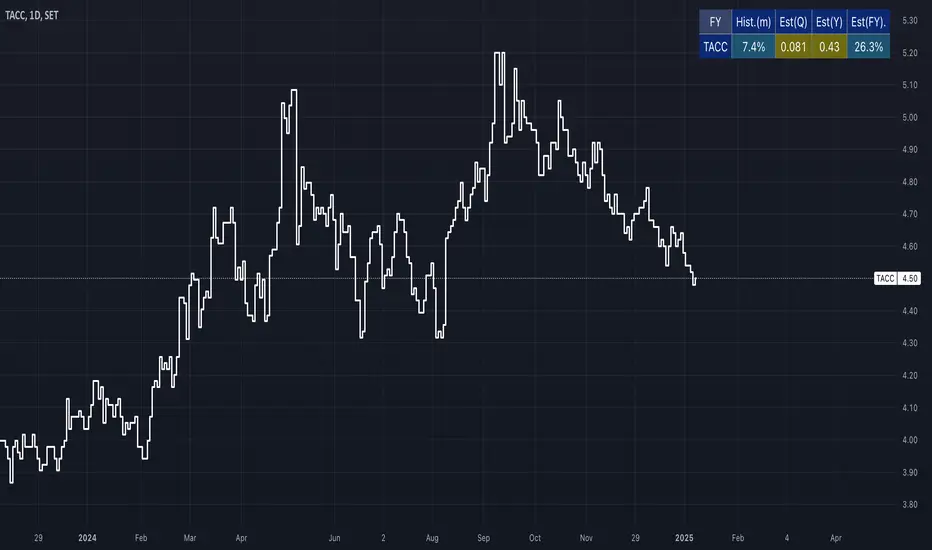
Show EPS Estimate by TradingView: Displays EPS estimate data from TradingView. (This retrieves the latest data available in TradingView; therefore, please verify the corresponding fiscal year.)
Position: Sets the indicator's display position on the chart, such as middle_right.
Text Size: Sets the text size of the displayed information, such as normal.
In summary, this indicator provides an overview of a company's earnings growth by comparing historical performance with forecasts, facilitating trend analysis and investment decisions. The various settings allow users to customize the display for their specific needs.
Note:
EPSm = EPS CAGR (Median)
REVm = Revenue CAGR (Median)
OPm = Operating income CAGR (Median)
DIVm = Dividend CAGR (Median)
EQm = Total Equity CAGR (Median)
ASm = Total Asset CAGR (Median)
***This indicator is designed for use on daily (D1) charts only. As it retrieves data by counting back bars, some inaccuracies may occur. For accuracy, please cross-reference the information with reliable sources.
Inputs (ข้อมูลนำเข้า): ส่วนนี้ใช้กำหนดรายละเอียดของข้อมูลที่นำมาคำนวณ
-Period (ช่วงเวลา): เลือกช่วงเวลาที่ต้องการวิเคราะห์ เช่น TTM (Trailing Twelve Months) คือ 12 เดือนล่าสุด หรือ FY ที่ใช้ข้อมูลของปีล่าสุด
-Show EPS Growth% (แสดง % การเติบโตทบต้นของ EPS): เลือกให้แสดงเปอร์เซ็นต์การเติบโตเฉลี่ยทบต้นของ EPS
-Show Median Growth% (แสดง % การเติบโตมัธยฐาน): เลือกให้แสดงมัธยฐานของการเติบโตเฉลี่ยทบต้น
-Show EPS Estimate by TradingView (แสดงการประมาณการ EPS โดย TradingView): แสดงข้อมูลการประมาณการ EPS จาก TradingView(เป็นการเรียกข้อมูลล่าสุดที่มีในเทรดดิ้งวิว ดังนั้นโปรดตรวจสอบ ว่าเป็นข้อมูลของปีไหน)
-Position (ตำแหน่ง): กำหนดตำแหน่งการแสดงผลของ Indicator บนหน้าจอ เช่น middle_rigth... (กลาง_ขวา)
-Text Size (ขนาดตัวอักษร): กำหนดขนาดตัวอักษรของข้อมูลที่แสดง เช่น normal (ปกติ)
โดยสรุป Indicator นี้ช่วยให้เห็นภาพรวมของการเติบโตของกำไรบริษัท โดยเปรียบเทียบอดีตกับการคาดการณ์ ทำให้วิเคราะห์แนวโน้มและตัดสินใจลงทุนได้ง่ายขึ้น และการตั้งค่าต่างๆ ช่วยให้ปรับแต่งการแสดงผลให้เหมาะสมกับการใช้งานของผู้ใช้
หมายเหตุ
EPSm=EPS CAGR(Median)
REVm=Revenue CAGR(Median)
OPm=Operating income CAGR(Median)
DIVm=Dividend CAGR(Median)
EQm=Total Equity CAGR(Median)
ASm=Total Asset CAGR(Median)
***Indicatorนี้ ออกแบบมาใช้กับ กราฟDay1 เท่านั้น โดยใช้การเรียกข้อมูลด้วยการนับBarย้อนหลัง อาจมีการผิดพลาดได้บ้าง ดังนั้นหากต้องการความแม่นยำที่สูงโปรดตรวจสอบข้อมูลกับแหล่งข้อมูลที่น่าเชื่อถืออีกครั้ง***
/////////////////////////////////////////////////////////////////////////////////////////
Indicator "[EAK] Growth rate (Hist.VS Est.)" is designed to display a company's growth rate by comparing historical data with estimates. The configuration options are as follows:
Inputs:
Period: Select the analysis period, such as TTM (Trailing Twelve Months), representing the last 12 months, or FY, which uses last full year data.
Show EPS Growth%: Enables the display of the compound annual growth rate (CAGR) of EPS.
Show Median Growth%: Enables the display of the median of the compound annual growth rate.
Show EPS Estimate by TradingView: Displays EPS estimate data from TradingView. (This retrieves the latest data available in TradingView; therefore, please verify the corresponding fiscal year.)
Position: Sets the indicator's display position on the chart, such as middle_right.
Text Size: Sets the text size of the displayed information, such as normal.
In summary, this indicator provides an overview of a company's earnings growth by comparing historical performance with forecasts, facilitating trend analysis and investment decisions. The various settings allow users to customize the display for their specific needs.
Note:
EPSm = EPS CAGR (Median)
REVm = Revenue CAGR (Median)
OPm = Operating income CAGR (Median)
DIVm = Dividend CAGR (Median)
EQm = Total Equity CAGR (Median)
ASm = Total Asset CAGR (Median)
***This indicator is designed for use on daily (D1) charts only. As it retrieves data by counting back bars, some inaccuracies may occur. For accuracy, please cross-reference the information with reliable sources.
Note di rilascio
Update 31Jan2025Add FCF Median
ปรับให้การแสดง Est(Q) เป็น Median Target Price
และใช้สีแดงบอกกรณีที่ข้อมูลของEst(FY)เป็นข้อมูลเก่า(หรือสังเกตจาก เป้าหมายที่เป็น NaN)
Script protetto
Questo script è pubblicato come codice protetto. Tuttavia, è possibile utilizzarle liberamente e senza alcuna limitazione – ulteriori informazioni qui.
Declinazione di responsabilità
Le informazioni e le pubblicazioni non sono intese come, e non costituiscono, consulenza o raccomandazioni finanziarie, di investimento, di trading o di altro tipo fornite o approvate da TradingView. Per ulteriori informazioni, consultare i Termini di utilizzo.