SEMA JMA | QuantEdgeB
📈 Introducing SEMA JMA by QuantEdgeB
🛠️ Overview
SEMA JMA is a precision-engineered, dual-signal trend indicator that blends Jurik Moving Average (JMA) logic with Double Exponential Moving Average (DEMA) smoothing and normalized statistical filters.
This advanced indicator is built for high-quality trend detection, reducing false signals by confirming momentum through both price-based SD bands and normalized JMA logic. The result is a powerful, noise-filtered tool ideal for directional trading in volatile and ranging environments.
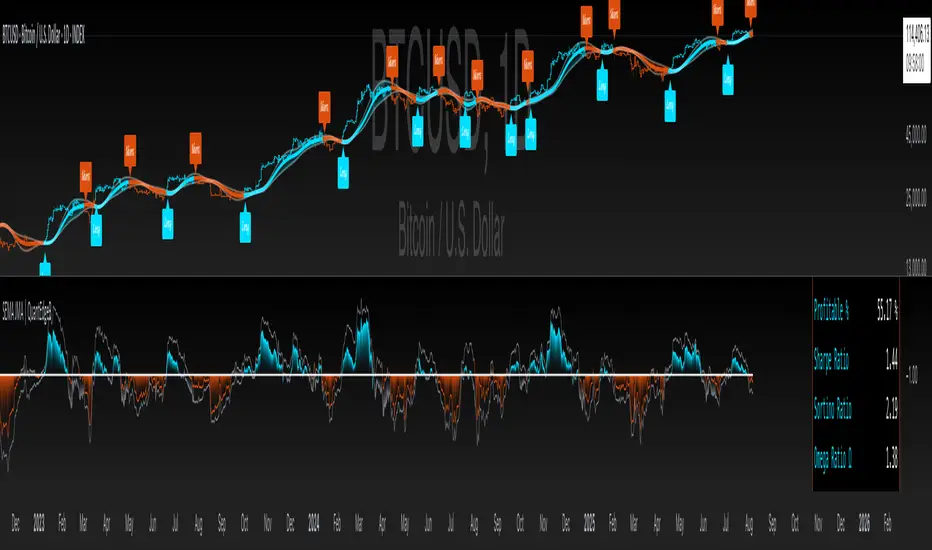
SEMA JMA offers adaptive volatility bands, backtest-ready analytics, and dynamic signal labeling, making it a favorite for traders demanding speed, precision, and strategic clarity.
✨ Key Features
🔹 Hybrid JMA + DEMA Core
Combines the ultra-smooth JMA with lag-reducing DEMA for exceptional trend clarity.
🔹 Volatility-Based SD Band Filtering
Uses rolling standard deviation on JMA for adaptive long/short bands that respond to market dynamics.
🔹 Normalized Price Filter Confirmation
A second JMA stream is normalized against price and filtered via SD for added trend confirmation and false signal suppression.
🔹 Backtest Integration & Equity Curve Plotting
Built-in compatibility with QuantEdgeB/BacktestingIndV2, delivering historical metrics, equity visualization, and strategic evaluation.
🔹 Fully Customizable UI
Includes label toggles, signal overlays, visual themes, and backtest table position selection.
📊 How It Works
1️⃣ JMA-DEMA Hybrid Trend Engine
The foundation of SEMA JMA lies in a custom-built JMA engine, enhanced by a DEMA smoothing layer to:
• Minimize lag without losing trend integrity.
• Maintain responsiveness in noisy or low-volume environments.
• Create a central trend structure used by both raw price and normalized filters.
2️⃣ Standard Deviation Band Filtering
SEMA JMA applies a rolling SD filter over the JMA signal. This creates adaptive upper and lower bands:
• Long Signal = Price > Upper Band
• Short Signal = Price < Lower Band
These bands adjust based on price volatility, offering a dynamic alternative to traditional fixed thresholds.
3️⃣ Normalized JMA for Momentum Confirmation
A second JMA-DEMA structure is normalized by dividing by price, then smoothed:
• If the normalized signal rises above -1, it suggests upside pressure.
• If it drops below -1, it signals momentum decay.
Only when both raw and normalized signals agree does the indicator issue a trade trigger.
✅ Signal Logic
📌 Long Signal →
🔹 Price breaks above volatility-adjusted upper SD band
🔹 AND Normalized JMA rises above -1
📌 Short Signal →
🔹 Price breaks below lower SD band
🔹 AND Normalized JMA falls below -1
⚙️ SEMA JMA stays in its active trend state until an opposing signal triggers, enabling tren riding while filtering short lived swings.
👥 Who Should Use It?
✅ Swing & Trend Traders → Ride strong directional moves with reduced whipsaws
✅ Volatility-Adaptive Systems → Filter trades using rolling SD-based thresholds
✅ Quantitative Strategy Builders → Deploy within algo-driven strategies using backtest-ready metrics
✅ Risk-Aware Traders → Use dual confirmation to minimize signal risk
⚙️ Customization & Default Settings
🔧 Core Settings:
• JMA Length (Default: 35) → Defines JMA sensitivity.
• DEMA Length (Default: 20) → Smoothing after JMA to refine structure.
• Normalized JMA Lengths → Control confirmation layer smoothness (default: 1 for short and long).
• Standard Deviation Length (Default: 30) → Determines the volatility lookback.
• SD Weight Factors → Separate values for long (default: 1.0) and short (default: 1.002) bands.
📊 Backtest Mode
SEMA JMA includes an optional backtest table, enabling traders to assess its historical effectiveness before applying it in live trading conditions.
🔹 Backtest Metrics Displayed:
• Equity Max Drawdown → Largest historical loss from peak equity.
• Profit Factor → Ratio of total profits to total losses, measuring system efficiency.
• Sharpe Ratio → Assesses risk-adjusted return performance.
• Sortino Ratio → Focuses on downside risk-adjusted returns.
• Omega Ratio → Evaluates return consistency & performance asymmetry.
• Half Kelly → Optimal position sizing based on risk/reward analysis.
• Total Trades & Win Rate → Assess historical success rate.
📌 Disclaimer:
Backtest results are based on past performance and do not guarantee future success. Always incorporate real-time validation and risk management in live trading.
🚀 Why This Matters?
✅ Strategy Validation → Gain insight into historical trend accuracy.
✅ Customization Insights → See how different settings impact performance.
✅ Risk Awareness → Understand potential drawdowns before deploying capital.
📌 How to Use SEMA JMA
🌀 Trend-Following Strategy
✔ Go Long: When price breaks above SD band and normalized momentum rises
✔ Go Short: When price breaks below SD band and normalized momentum falls
✔ Stay in position: Until signal reversal confirms
⚙️ Volatility-Adaptive Configuration
✔ Tune w1 (Long SD weight) and w2 (Short SD weight) for responsiveness
✔ Increase SD length in noisy markets for smoother bands
📌 Conclusion
SEMA JMA by QuantEdgeB delivers surgical precision trend signals using a dual-layer approach:
• JMA + DEMA core smoothing
• Statistical SD breakout filters
• Normalized confirmation logic
It’s a versatile indicator suited for trend-following, volatility tracking, and system-based signal generation—engineered for clarity, confidence, and adaptability.
🔹 Key Takeaways:
1️⃣ Multi-Filter Trend Logic – JMA + DEMA + Normalized filtering for high-confidence signals
2️⃣ SD-Based Volatility Control – Reduces noise, avoids ATR limitations
3️⃣ Quant-Ready System – Includes full backtesting
📌 Master your market edge with precision – SEMA JMA | QuantEdgeB
🔹 Disclaimer: Past performance is not indicative of future results.
🔹 Strategic Advice: Always backtest, optimize, and align parameters with your trading objectives and risk tolerance before live trading.
Script su invito
Solo gli utenti approvati dall'autore possono accedere a questo script. È necessario richiedere e ottenere l'autorizzazione per utilizzarlo. Tale autorizzazione viene solitamente concessa dopo il pagamento. Per ulteriori dettagli, seguire le istruzioni dell'autore riportate di seguito o contattare direttamente QuantEdgeB.
TradingView NON consiglia di acquistare o utilizzare uno script a meno che non si abbia piena fiducia nel suo autore e se ne comprenda il funzionamento. È inoltre possibile trovare alternative gratuite e open source nei nostri script della community.
Istruzioni dell'autore
whop.com/quantedgeb/ 💎
🔹 Unlock our free toolbox:
tradinglibrary.carrd.co/ 🛠️
Disclaimer: All resources and indicators provided are for educational purposes only
Declinazione di responsabilità
Script su invito
Solo gli utenti approvati dall'autore possono accedere a questo script. È necessario richiedere e ottenere l'autorizzazione per utilizzarlo. Tale autorizzazione viene solitamente concessa dopo il pagamento. Per ulteriori dettagli, seguire le istruzioni dell'autore riportate di seguito o contattare direttamente QuantEdgeB.
TradingView NON consiglia di acquistare o utilizzare uno script a meno che non si abbia piena fiducia nel suo autore e se ne comprenda il funzionamento. È inoltre possibile trovare alternative gratuite e open source nei nostri script della community.
Istruzioni dell'autore
whop.com/quantedgeb/ 💎
🔹 Unlock our free toolbox:
tradinglibrary.carrd.co/ 🛠️
Disclaimer: All resources and indicators provided are for educational purposes only