PROTECTED SOURCE SCRIPT
Delta Weighted Average Price (DWAP) @MaxMaserati 2.0
MMM DWAP (Delta Weighted Average Price) - Trading Indicator Guide
Overview
The MMM DWAP (Delta Weighted Average Price) indicator analyzes volume-price relationships by incorporating buying and selling pressure (delta) to identify key support and resistance levels. This tool provides multi-timeframe analysis with momentum assessment and breakout detection capabilities.
Core Methodology
MMM DWAP calculates weighted average prices based on delta (buying vs selling pressure) rather than volume alone. This approach reveals where directional money flow creates sustainable support and resistance levels, providing traders with enhanced market analysis.
Key Innovation: Fair Value Magnetism
The market facilitates fair exchange between buyers and sellers. The indicator identifies dynamic fair value zones through delta-weighted cloud bands. Price tends to return to these levels, creating high-probability reaction points for trading decisions.
Technical Comparison
vs VWAP
- VWAP: Volume-weighted calculation showing where volume occurred
- MMM DWAP: Delta-weighted analysis revealing directional money flow with multi-timeframe integration
vs Moving Averages
- Moving Averages: Price-only calculation with inherent lag
- MMM DWAP: Real-time delta analysis providing delta-defended levels with market context
vs Bollinger Bands
- Bollinger Bands: Statistical volatility measures for squeeze detection
- MMM DWAP: Breakout prediction with confidence levels based on market pressure analysis
Visual Components
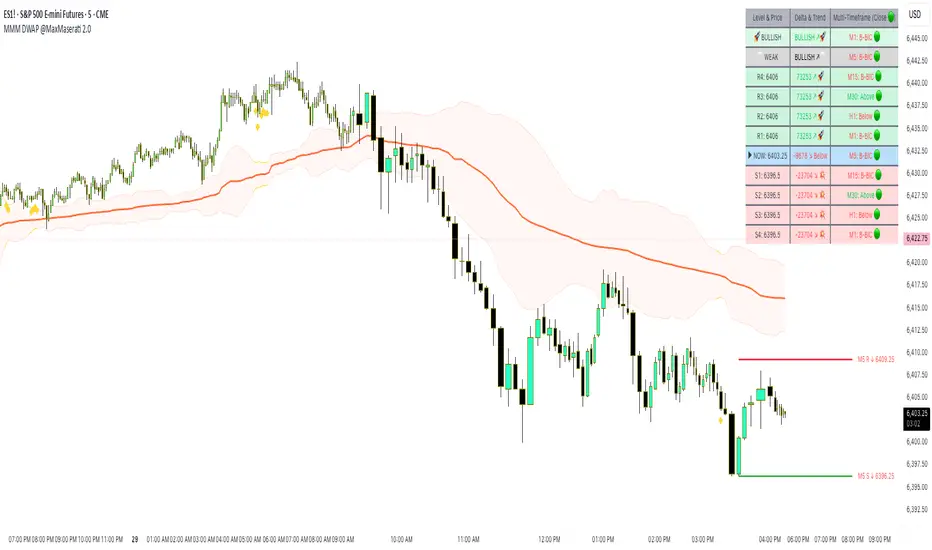
MMM DWAP Line (Orange): Primary fair value level based on delta weighting
Dynamic Cloud Bands: Overbought/oversold zones with fair value magnetism
Support/Resistance Lines: Multi-timeframe key levels with delta directional indicators
Squeeze Detection: Volatility compression alerts with breakout direction prediction
Analysis Table: Real-time consensus direction, momentum strength, and breakout predictions
Fair Value Zone Concept
Orange Line: Absolute Fair Value Price - the natural equilibrium level where price gravitates. Most important support/resistance level.
Price closed below the line

Price closed above the line

Upper Cloud = Bullish Fair Value Area (BuFV):
- When price is above Orange Line, Upper Cloud acts as support
- Price pullbacks to this zone create buying opportunities
- Represents fair value in bullish market conditions

Far Above Upper Cloud = "TOO HIGH" Zone:
- Price is overextended above fair value
- Overbought condition - likely to reverse DOWN to Upper Cloud (BuFV)
- Sell signal area or profit-taking zone for longs

Lower Cloud = Bearish Fair Value Area (BeFV):
- When price is below Orange Line, Lower Cloud acts as resistance
- Price rallies to this zone create selling opportunities
- Represents fair value in bearish market conditions

Far Below Lower Cloud = "TOO LOW" Zone:
- Price is overextended below fair value
- Oversold condition - likely to reverse UP to Lower Cloud (BeFV)
- Buy signal area or profit-taking zone for shorts
Rubber Band Effect:
- Upper Cloud (BuFV): If price stretches TOO FAR UP → snaps back DOWN to fair value area
- Lower Cloud (BeFV): If price stretches TOO FAR DOWN → snaps back UP to fair value area
Support & Resistance Intelligence
Resistance Line Behavior:
Red Arrow Down (R ↓):
- Bearish delta at resistance level
- Sellers are defending this resistance
- Strong selling pressure - price likely to reject downward
- Traditional resistance behavior - SELL zone
Green Arrow Up (R ↑):
- Bullish delta at resistance level
- Buyers are challenging this resistance
- Strong buying pressure pushing through
- Potential breakout signal - BUY zone
Support Line Behavior:
Green Arrow Up (S ↑):
- Bullish delta at support level
- Buyers are defending this support
- Strong buying interest - price likely to bounce up
- Traditional support behavior - BUY zone

Red Arrow Down (S ↓):
- Bearish delta at support level
- Sellers are overwhelming support
- Strong selling pressure breaking through
- Potential breakdown signal - SELL zone

When the arrow is → for the Support and Resistance line, it is a neutral state

4-Phase Breakout Cycle
Phase 1 - Normal Trading: Regular price movement with bands at normal width
Phase 2 - Band Tightening (SQUEEZE): Yellow diamonds appear as bands compress. Breakout direction prediction activates - early warning before the move.
Phase 3 - Balloon Formation: Bands expand outward, forming balloon shape around price. Preparation phase - volatility releasing but price still contained.
Phase 4 - Explosive Breakout: Price breaks decisively through expanded bands with volume surge and directional momentum. Execution phase.

Strategy Sequence:
- Tightening Phase = PREDICT (Get direction forecast)
- Balloon Phase = PREPARE (Confirm setup and position size)
- Breakout Phase = EXECUTE (Enter trade in predicted direction)

Trading Applications
Retest Strategy:
1. Identify trend bias through MMM DWAP line position
2. Monitor for breakouts above/below Orange Line
3. Wait for pullback to appropriate Fair Value zone (BuFV or BeFV)
4. Execute trades on reaction at fair value levels
High-Probability Setups:
- Bullish Breakout: Bullish consensus + Strong momentum + Resistance with strong buying delta
- Bearish Rejection: Bearish consensus + Strong momentum + Resistance with strong selling delta
- Support Bounce: Bullish consensus + Support with strong buying delta
Analysis Table Guide
Consensus Row: Overall market sentiment based on volume-weighted buying/selling pressure
- BULLISH: Look for long opportunities
- BEARISH: Look for short opportunities
Momentum Row: Current strength compared to recent average
- STRONG: High conviction moves - ride momentum
- WEAK: Low conviction moves - wait for better setups
Price Level Rows (R1, R2, S1, S2): Delta pressure at each level
- High positive delta = Buyers dominated (potential breakout level)
- High negative delta = Sellers dominated (potential rejection level)
Risk Management
- Stop Levels: Orange Line breaks or opposite band extremes
- Profit Targets: Opposite fair value zones
- Position Sizing: Based on momentum strength indicators
Technical Notes
- Delta Calculation: Bullish volume minus bearish volume for directional pressure
- Timeframe Independence: MMM DWAP and S/R levels can utilize different timeframes
- Squeeze Algorithm: Adaptive band width analysis for volatility compression
- Consensus Logic: Aggregate delta analysis across multiple price levels
- Fair Value Zones: Dynamic BuFV/BeFV adaptation based on Orange Line position
Note: This indicator combines volume-price analysis with order flow concepts. Effectiveness depends on market liquidity and proper application of fair value principles. Most effective setups occur when consensus direction, momentum strength, squeeze detection, and favorable delta history align.
Overview
The MMM DWAP (Delta Weighted Average Price) indicator analyzes volume-price relationships by incorporating buying and selling pressure (delta) to identify key support and resistance levels. This tool provides multi-timeframe analysis with momentum assessment and breakout detection capabilities.
Core Methodology
MMM DWAP calculates weighted average prices based on delta (buying vs selling pressure) rather than volume alone. This approach reveals where directional money flow creates sustainable support and resistance levels, providing traders with enhanced market analysis.
Key Innovation: Fair Value Magnetism
The market facilitates fair exchange between buyers and sellers. The indicator identifies dynamic fair value zones through delta-weighted cloud bands. Price tends to return to these levels, creating high-probability reaction points for trading decisions.
Technical Comparison
vs VWAP
- VWAP: Volume-weighted calculation showing where volume occurred
- MMM DWAP: Delta-weighted analysis revealing directional money flow with multi-timeframe integration
vs Moving Averages
- Moving Averages: Price-only calculation with inherent lag
- MMM DWAP: Real-time delta analysis providing delta-defended levels with market context
vs Bollinger Bands
- Bollinger Bands: Statistical volatility measures for squeeze detection
- MMM DWAP: Breakout prediction with confidence levels based on market pressure analysis
Visual Components
MMM DWAP Line (Orange): Primary fair value level based on delta weighting
Dynamic Cloud Bands: Overbought/oversold zones with fair value magnetism
Support/Resistance Lines: Multi-timeframe key levels with delta directional indicators
Squeeze Detection: Volatility compression alerts with breakout direction prediction
Analysis Table: Real-time consensus direction, momentum strength, and breakout predictions
Fair Value Zone Concept
Orange Line: Absolute Fair Value Price - the natural equilibrium level where price gravitates. Most important support/resistance level.
Price closed below the line
Price closed above the line
Upper Cloud = Bullish Fair Value Area (BuFV):
- When price is above Orange Line, Upper Cloud acts as support
- Price pullbacks to this zone create buying opportunities
- Represents fair value in bullish market conditions
Far Above Upper Cloud = "TOO HIGH" Zone:
- Price is overextended above fair value
- Overbought condition - likely to reverse DOWN to Upper Cloud (BuFV)
- Sell signal area or profit-taking zone for longs
Lower Cloud = Bearish Fair Value Area (BeFV):
- When price is below Orange Line, Lower Cloud acts as resistance
- Price rallies to this zone create selling opportunities
- Represents fair value in bearish market conditions
Far Below Lower Cloud = "TOO LOW" Zone:
- Price is overextended below fair value
- Oversold condition - likely to reverse UP to Lower Cloud (BeFV)
- Buy signal area or profit-taking zone for shorts
Rubber Band Effect:
- Upper Cloud (BuFV): If price stretches TOO FAR UP → snaps back DOWN to fair value area
- Lower Cloud (BeFV): If price stretches TOO FAR DOWN → snaps back UP to fair value area
Support & Resistance Intelligence
Resistance Line Behavior:
Red Arrow Down (R ↓):
- Bearish delta at resistance level
- Sellers are defending this resistance
- Strong selling pressure - price likely to reject downward
- Traditional resistance behavior - SELL zone
Green Arrow Up (R ↑):
- Bullish delta at resistance level
- Buyers are challenging this resistance
- Strong buying pressure pushing through
- Potential breakout signal - BUY zone
Support Line Behavior:
Green Arrow Up (S ↑):
- Bullish delta at support level
- Buyers are defending this support
- Strong buying interest - price likely to bounce up
- Traditional support behavior - BUY zone
Red Arrow Down (S ↓):
- Bearish delta at support level
- Sellers are overwhelming support
- Strong selling pressure breaking through
- Potential breakdown signal - SELL zone
When the arrow is → for the Support and Resistance line, it is a neutral state
4-Phase Breakout Cycle
Phase 1 - Normal Trading: Regular price movement with bands at normal width
Phase 2 - Band Tightening (SQUEEZE): Yellow diamonds appear as bands compress. Breakout direction prediction activates - early warning before the move.
Phase 3 - Balloon Formation: Bands expand outward, forming balloon shape around price. Preparation phase - volatility releasing but price still contained.
Phase 4 - Explosive Breakout: Price breaks decisively through expanded bands with volume surge and directional momentum. Execution phase.
Strategy Sequence:
- Tightening Phase = PREDICT (Get direction forecast)
- Balloon Phase = PREPARE (Confirm setup and position size)
- Breakout Phase = EXECUTE (Enter trade in predicted direction)
Trading Applications
Retest Strategy:
1. Identify trend bias through MMM DWAP line position
2. Monitor for breakouts above/below Orange Line
3. Wait for pullback to appropriate Fair Value zone (BuFV or BeFV)
4. Execute trades on reaction at fair value levels
High-Probability Setups:
- Bullish Breakout: Bullish consensus + Strong momentum + Resistance with strong buying delta
- Bearish Rejection: Bearish consensus + Strong momentum + Resistance with strong selling delta
- Support Bounce: Bullish consensus + Support with strong buying delta
Analysis Table Guide
Consensus Row: Overall market sentiment based on volume-weighted buying/selling pressure
- BULLISH: Look for long opportunities
- BEARISH: Look for short opportunities
Momentum Row: Current strength compared to recent average
- STRONG: High conviction moves - ride momentum
- WEAK: Low conviction moves - wait for better setups
Price Level Rows (R1, R2, S1, S2): Delta pressure at each level
- High positive delta = Buyers dominated (potential breakout level)
- High negative delta = Sellers dominated (potential rejection level)
Risk Management
- Stop Levels: Orange Line breaks or opposite band extremes
- Profit Targets: Opposite fair value zones
- Position Sizing: Based on momentum strength indicators
Technical Notes
- Delta Calculation: Bullish volume minus bearish volume for directional pressure
- Timeframe Independence: MMM DWAP and S/R levels can utilize different timeframes
- Squeeze Algorithm: Adaptive band width analysis for volatility compression
- Consensus Logic: Aggregate delta analysis across multiple price levels
- Fair Value Zones: Dynamic BuFV/BeFV adaptation based on Orange Line position
Note: This indicator combines volume-price analysis with order flow concepts. Effectiveness depends on market liquidity and proper application of fair value principles. Most effective setups occur when consensus direction, momentum strength, squeeze detection, and favorable delta history align.
Script protetto
Questo script è pubblicato come codice protetto. Tuttavia, è possibile utilizzarle liberamente e senza alcuna limitazione – ulteriori informazioni qui.
MMM : No body close (PO4), No Trade.
Declinazione di responsabilità
Le informazioni e le pubblicazioni non sono intese come, e non costituiscono, consulenza o raccomandazioni finanziarie, di investimento, di trading o di altro tipo fornite o approvate da TradingView. Per ulteriori informazioni, consultare i Termini di utilizzo.