PROTECTED SOURCE SCRIPT
Aggiornato Candle box - All Sessions
Candle Box – All Sessions + Weekday Filter
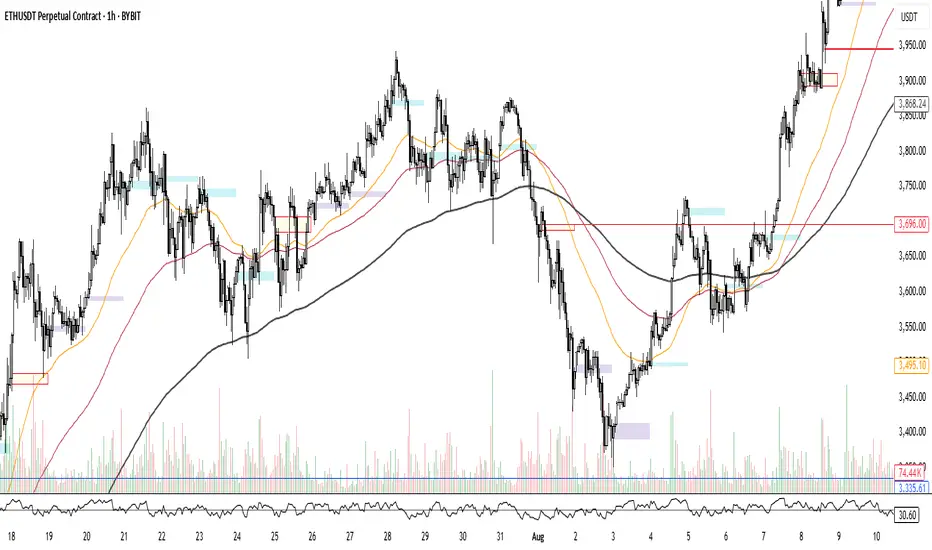
This indicator automatically draws boxes on your chart, highlighting custom sessions based on user-defined start and end times.
For each selected session, it visually marks the high and low of the opening candle from your chosen timeframe, making it easy to analyze volatility, breakouts, and ranges.
Key Features:
Full Time Customization: Choose the start and end hour/minute for your session boxes.
Reference Candle Timeframe: Select which timeframe’s high/low to use (e.g., 5min, 15min, etc).
Weekday Selection: Display boxes only on the days of the week you want—any combination of weekdays and weekends.
Session History: All previous session boxes remain visible on the chart, allowing easy review of price behavior across multiple days.
Visual Customization: Adjust border color, background color, and border width for each box.
Typical Uses:
Highlight volatility during key market sessions (e.g., NY Open, London, Close, etc.).
Mark opening ranges for daily or any custom time window.
Identify breakout and consolidation patterns across sessions.
How to Use:
Add the indicator to your chart.
Configure your preferred start/end time, reference candle timeframe, visual style, and select the days of the week.
The indicator will automatically draw all session boxes for both current and past days, making market structure and session dynamics instantly clear.
Note di rilascio
Title: Candle Box – All Sessions + Weekly Color CustomizationDescription:
This indicator draws customizable candle boxes for any chosen session time, allowing traders to highlight key market ranges during the day.
Features include:
Select start and end times for the box.
Choose the timeframe of the first candle used to set the box's high and low.
Show/Hide boxes for each day of the week.
Custom colors per day of the week or a single color for all days.
Adjustable border thickness and transparency.
Supports up to 100 historical boxes displayed on the chart.
Perfect for traders who want to visually separate trading sessions, highlight important daily ranges, or track market behavior across different weekdays.
Script protetto
Questo script è pubblicato come codice protetto. Tuttavia, è possibile utilizzarle liberamente e senza alcuna limitazione – ulteriori informazioni qui.
Declinazione di responsabilità
Le informazioni e le pubblicazioni non sono intese come, e non costituiscono, consulenza o raccomandazioni finanziarie, di investimento, di trading o di altro tipo fornite o approvate da TradingView. Per ulteriori informazioni, consultare i Termini di utilizzo.