PROTECTED SOURCE SCRIPT
Heatmap Volume

# Heatmap Volume (HeatVol) Indicator
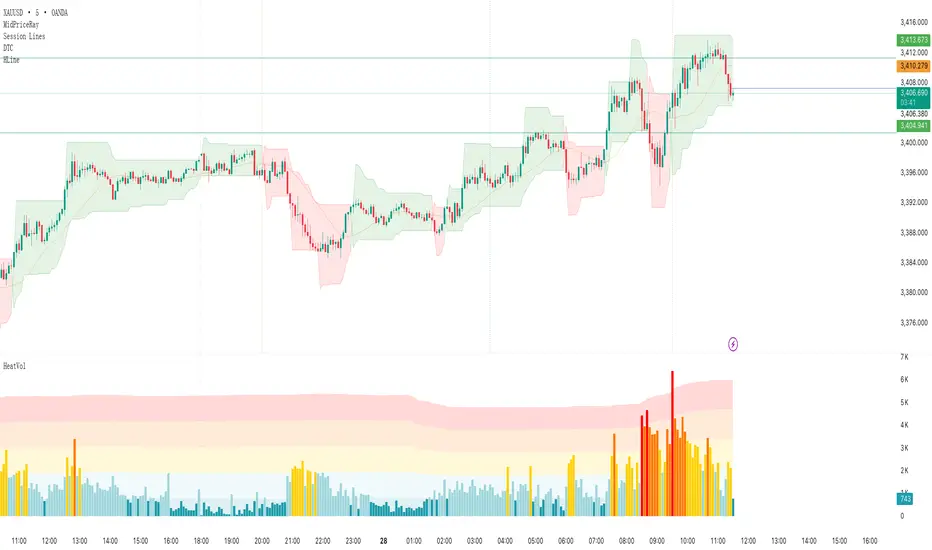
A sophisticated volume analysis tool that visualizes trading volume intensity through a dynamic heatmap system. This indicator helps traders identify significant volume patterns and potential market turning points by comparing current volume to historical averages.
## Key Features
1. **Dynamic Volume Analysis**
- Moving average based volume comparison
- Standard deviation based threshold calculation
- Multiple volume intensity levels (Extra High, High, Medium, Normal, Low)
- Customizable lookback periods for both MA and Standard Deviation
2. **Visual Representation**
- Heatmap color coding for volume intensity
- Optional colored volume bars
- Multiple display modes (Lines, Backgrounds, Both, None)
- Two color schemes (Heatmap or Up/Down)
3. **Flexible Configuration**
- Adjustable threshold multipliers for each intensity level
- Customizable colors for all volume levels
- Separate color settings for bullish and bearish volumes
- Transparent overlays for clear price action visibility
4. **Alert System**
- Volume threshold breach notifications
- Direction-specific alerts (Up/Down)
- Multiple alert conditions for different volume levels
## Trading Applications
1. **Volume Analysis**
- Identify unusual volume spikes
- Detect volume divergences
- Monitor volume trend changes
- Spot potential accumulation/distribution
2. **Market Psychology**
- Gauge market participation levels
- Identify potential exhaustion points
- Confirm price movements with volume
3. **Trade Validation**
- Confirm breakouts with volume
- Validate trend strength
- Identify potential false moves
## Setup Guide
1. **Period Settings**
- Adjust MA length (default: 610) based on your timeframe
- Set Standard Deviation period for volatility sensitivity
- Fine-tune threshold multipliers for market conditions
2. **Visual Configuration**
- Choose between Heatmap or Up/Down color modes
- Select display style (Lines, Backgrounds, Both)
- Customize colors for different volume levels
## Best Practices
1. Use longer periods for trend analysis, shorter for day trading
2. Combine with price action for better trade decisions
3. Pay attention to color transitions for volume trend changes
4. Use alerts to catch significant volume events
## Notes
1. Higher threshold multipliers mean more selective volume signals
2. Color intensity reflects volume significance
3. Background mode provides better overall volume trend visibility
4. Line mode helps identify specific volume thresholds
This indicator is particularly useful for traders who rely on volume analysis for their trading decisions. It provides a clear visual representation of volume intensity and helps identify potentially significant market moves through volume analysis.
Script protetto
Questo script è pubblicato come codice protetto. Tuttavia, è possibile utilizzarle liberamente e senza alcuna limitazione – ulteriori informazioni qui.
Declinazione di responsabilità
Le informazioni e le pubblicazioni non sono intese come, e non costituiscono, consulenza o raccomandazioni finanziarie, di investimento, di trading o di altro tipo fornite o approvate da TradingView. Per ulteriori informazioni, consultare i Termini di utilizzo.