Mean Reversion Trading With IV Metrics (By MC) - Mobile Friendly
Key Features & How They Work Together
1. Mean Reversion Probability & Z-Score
- Mean Reversion Analysis: Calculates z-scores and statistical probabilities that the asset’s price will revert to its mean, using customizable lookback windows (e.g., 10-60 bars). This helps traders spot potentially overbought or oversold conditions.
- Strong & Moderate Signals: Highlights strong and moderate reversion opportunities based on user-defined probability thresholds, providing clear visual cues for timing entries and exits.
2. Paired Asset Correlation
- Pairs Trading Support: Allows comparison of two symbols (e.g., SPY vs TLT). It computes the ratio, rolling mean, standard deviation, and correlation, helping traders identify divergence/convergence opportunities in pairs trading.
3. Volatility Metrics & Projections
- Historical & Implied Volatility: Estimates implied volatility (IV) using historical price data, calculates IVR (the asset’s IV relative to its own history), and provides user-customized percentile bands (e.g., 20th/80th percentiles).
- Fair IV Calculation: Offers three methods to compute “fair” volatility:
Market-Aware (relative to VIX/SPX HV)
SMA of historical volatility
SMA of VIX Traders can choose the method that best fits current market conditions. - Future Projections: Projects IV, “Fair” IV, and IVR for a user-defined future period, giving insight into potential volatility trends.
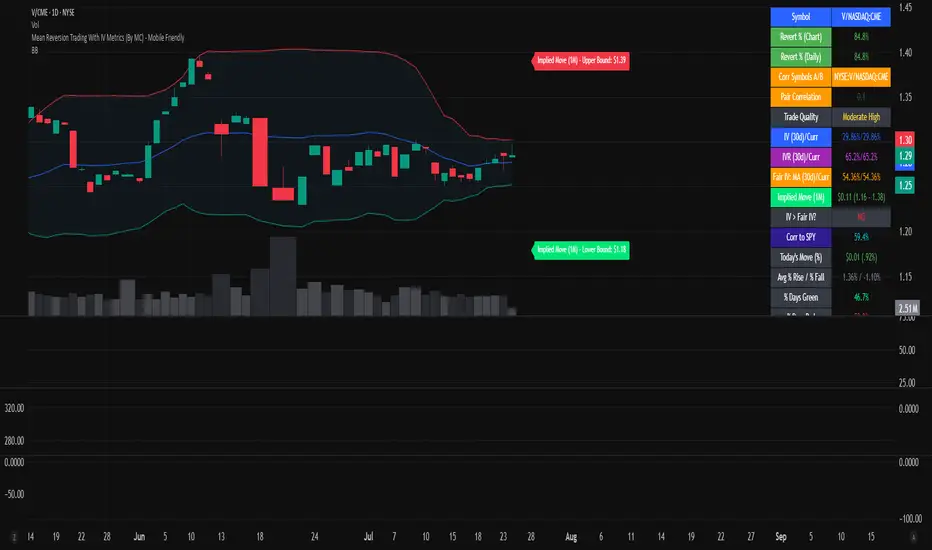
4. Implied Move Range
- Implied Move Calculation: Shows the expected price range (upper/lower bounds) for the forecast period based on the current IV, making risk management and target setting more objective.
- Dynamic Labels: Automatically updates labels with the latest projected moves and bounds, keeping traders informed in real time.
5. Market Volatility Dashboard
- Broad Market Indicators: Displays real-time values and daily changes for VIX, VIX1D, VVIX, MOVE (bond volatility), GVZ (gold volatility), and OVX (oil volatility). Color-coded thresholds help traders gauge market stress across asset classes.
- Correlation to SPY: Shows how closely the asset moves with SPY, aiding in diversification and hedging decisions.
6. Performance Metrics
- Daily Move Analysis: Tracks today’s price move (absolute and percentage), average rises/falls, and the percentage of green/red days over a custom period.
- Trade Quality Assessment: Ranks trade opportunities (High/Moderate/Low/Very Low) based on mean reversion probability.
7. Highly Customizable Table
- Mobile Friendly: The stats table can be placed anywhere on the chart, toggled between compact/full/extra modes, and resized for readability on any device.
- Visual Cues: Color coding and dynamic labels make interpretation easy and fast.
8. Alert Conditions
- Built-in alerts for strong/moderate mean reversion, IV crossing above/below “Fair” IV, allowing proactive trade management.
9. VIX-Based Expected Move Bands
- Optionally plots ±1, 2, 3 standard deviation bands using VIX-based expected move, helping to visualize potential price extremes.
How These Features Help Traders
- Unified Trading Dashboard: All key mean reversion and volatility insights are available at a glance, reducing the need to switch between multiple indicators or screens.
- Informed Entries & Exits: By combining mean reversion probabilities, IV projections, and market volatility, traders can time trades more confidently and avoid false signals.
- Risk Management: The implied move bounds and volatility levels support realistic stop-loss and target setting, adapting dynamically to market conditions.
- Cross-Asset Awareness: Market-wide volatility metrics and asset correlation to SPY provide context, helping traders avoid surprises from macro shocks.
- Pairs Trading: Direct support for ratio and correlation analysis streamlines pairs strategies.
- Customization & Clarity: The flexible UI and color-coded stats make the tool accessible for both beginners and advanced users.
Mean Reversion, Correlation value & interpretation:
For Meant Reversion % Probability:
Lookback Period to use:
| Trading Horizon | Lookback Period (Length) | Rationale |
| 5–10 days | 10–20 bars | More sensitive, good for quick reversals |
| 10–20 days | 20–30 bars | Standard for short swing |
| 20–40 days | 40–60 bars | More stable mean for longer swing |
Interpretation Guide:
Only consider trades if Correlation ≥ 0.6 or Reversion % ≥ 75%.
Avoid trades with Reversion % < 20%.
Correlation and Reversion % together form a powerful trade quality filter.
| Reversion % | Correlation | Signal Strength | Action |
| ≥ 75% | ≥ 0.4 | High Probability | Consider full position |
| ≥ 50% | ≥ 0.6 | Moderate Probability | Trade with standard size |
| ≥ 75% | < 0.4 | Uncorrelated Edge | Trade small or hedge carefully |
| < 50% | Any | Weak | Avoid |
| Any | < 0.3 | Low Coherence | Avoid unless extreme Reversion |
| Correlation Value | Interpretation |
| +1.0 | Perfect positive correlation (price of both move in the same direction)|
| +0.7 to +0.9 | Strong positive correlation |
| +0.4 to +0.6 | Moderate positive correlation |
| 0 | No correlation (independent) |
| -0.4 to -0.6 | Moderate negative correlation |
| -0.7 to -0.9 | Strong negative correlation |
| -1.0 | Perfect negative correlation (price both move in the opposite direction)|
Summary:
This script empowers traders to navigate markets with a robust, data-driven approach, seamlessly blending mean reversion analytics with deep volatility insight—all in a mobile-friendly, customizable dashboard.
Disclaimer
This tool is for informational and educational purposes only. It does not provide financial advice or trading signals. Always do your own research and consult a professional before making investment decisions.
Script su invito
Solo gli utenti approvati dall'autore possono accedere a questo script. È necessario richiedere e ottenere l'autorizzazione per utilizzarlo. Tale autorizzazione viene solitamente concessa dopo il pagamento. Per ulteriori dettagli, seguire le istruzioni dell'autore riportate di seguito o contattare direttamente mclee1.2006.
TradingView NON consiglia di acquistare o utilizzare uno script a meno che non si abbia piena fiducia nel suo autore e se ne comprenda il funzionamento. È inoltre possibile trovare alternative gratuite e open source nei nostri script della community.
Istruzioni dell'autore
Declinazione di responsabilità
Script su invito
Solo gli utenti approvati dall'autore possono accedere a questo script. È necessario richiedere e ottenere l'autorizzazione per utilizzarlo. Tale autorizzazione viene solitamente concessa dopo il pagamento. Per ulteriori dettagli, seguire le istruzioni dell'autore riportate di seguito o contattare direttamente mclee1.2006.
TradingView NON consiglia di acquistare o utilizzare uno script a meno che non si abbia piena fiducia nel suo autore e se ne comprenda il funzionamento. È inoltre possibile trovare alternative gratuite e open source nei nostri script della community.