OPEN-SOURCE SCRIPT
Prometheus Fractal-Based Trend
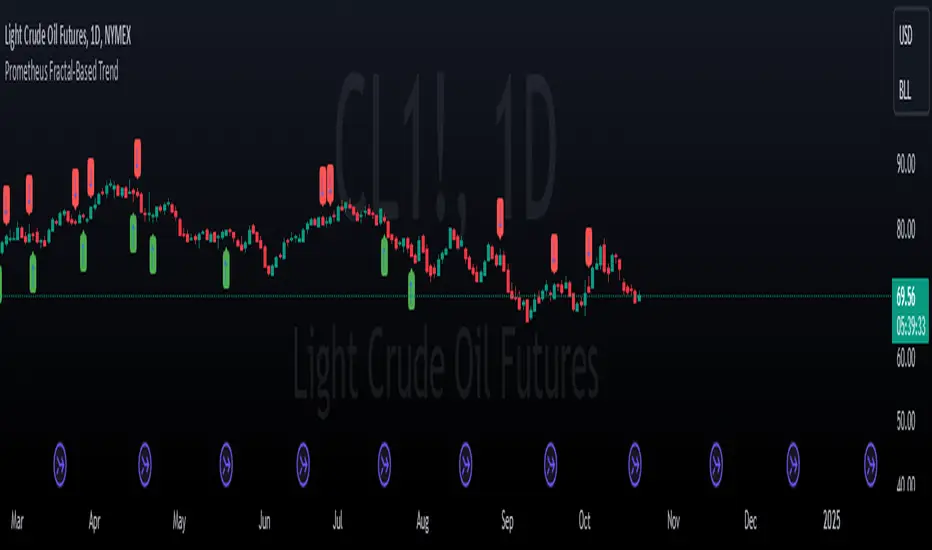
The Fractal-Based Trend indicator is a tool that uses fractals to try and detect which direction an underlying will continue to go.
Calculation:
A bullish fractal occurs when the current bar's high is lower than the previous bar high, and the previous bar's high is higher than both the high from two bars ago and the high from three bars ago.
A bearish fractal happens when the current bar's low is higher than the previous bar's low, and the previous bar's low is lower than both the low from two bars ago and the low from three bars ago.
When a bullish or bearish fractal forms, the corresponding value stored is the previous bar high for a bearish fractal or the previous bar's low for a bullish fractal.
The trade scenarios are when these fractals occur, a green or red label being plotted on the chart for whatever direction it predicts.
Trade examples:

We see on this daily chart of SPY that the fractals represent the potential for a directional trade that can last a few days. The more volatile a chart is the more of these fractals we can see.

We see on this 5 minute chart for TSLA there is way more activity, there are more sporadic candles on a lower time frame, so we can see more anomalies in the price action.

We see this to be true for BTCUSD even on a daily time frame, since it is very volatile. There are a lot of these labels plotted.
This is the perspective we aim to provide. We encourage traders to not follow indicators blindly. No indicator is 100% accurate. This one can give you a different perspective of price strength with volatility. We encourage any comments about desired updates or criticism!
Calculation:
A bullish fractal occurs when the current bar's high is lower than the previous bar high, and the previous bar's high is higher than both the high from two bars ago and the high from three bars ago.
A bearish fractal happens when the current bar's low is higher than the previous bar's low, and the previous bar's low is lower than both the low from two bars ago and the low from three bars ago.
When a bullish or bearish fractal forms, the corresponding value stored is the previous bar high for a bearish fractal or the previous bar's low for a bullish fractal.
The trade scenarios are when these fractals occur, a green or red label being plotted on the chart for whatever direction it predicts.
Trade examples:
We see on this daily chart of
We see on this 5 minute chart for
We see this to be true for
This is the perspective we aim to provide. We encourage traders to not follow indicators blindly. No indicator is 100% accurate. This one can give you a different perspective of price strength with volatility. We encourage any comments about desired updates or criticism!
Script open-source
Nello spirito di TradingView, l'autore di questo script lo ha reso open source, in modo che i trader possano esaminarne e verificarne la funzionalità. Complimenti all'autore! Sebbene sia possibile utilizzarlo gratuitamente, ricordiamo che la ripubblicazione del codice è soggetta al nostro Regolamento.
Declinazione di responsabilità
Le informazioni e le pubblicazioni non sono intese come, e non costituiscono, consulenza o raccomandazioni finanziarie, di investimento, di trading o di altro tipo fornite o approvate da TradingView. Per ulteriori informazioni, consultare i Termini di utilizzo.