OPEN-SOURCE SCRIPT
UCS_S_Steve Primo - Strategy 3
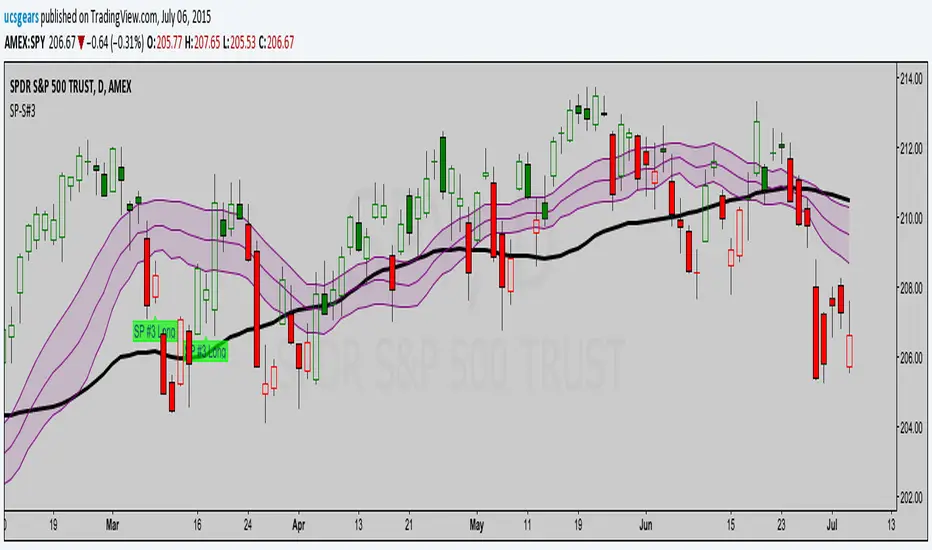
Here is the code for Steve Primo Strategy #1 - Setup Long and Short
- Please refer to his videos for triggers and management.
Share your views.
- Please refer to his videos for triggers and management.
Share your views.
Script open-source
In pieno spirito TradingView, il creatore di questo script lo ha reso open-source, in modo che i trader possano esaminarlo e verificarne la funzionalità. Complimenti all'autore! Sebbene sia possibile utilizzarlo gratuitamente, ricorda che la ripubblicazione del codice è soggetta al nostro Regolamento.
Uday C Santhakumar
Declinazione di responsabilità
Le informazioni ed i contenuti pubblicati non costituiscono in alcun modo una sollecitazione ad investire o ad operare nei mercati finanziari. Non sono inoltre fornite o supportate da TradingView. Maggiori dettagli nelle Condizioni d'uso.