OPEN-SOURCE SCRIPT
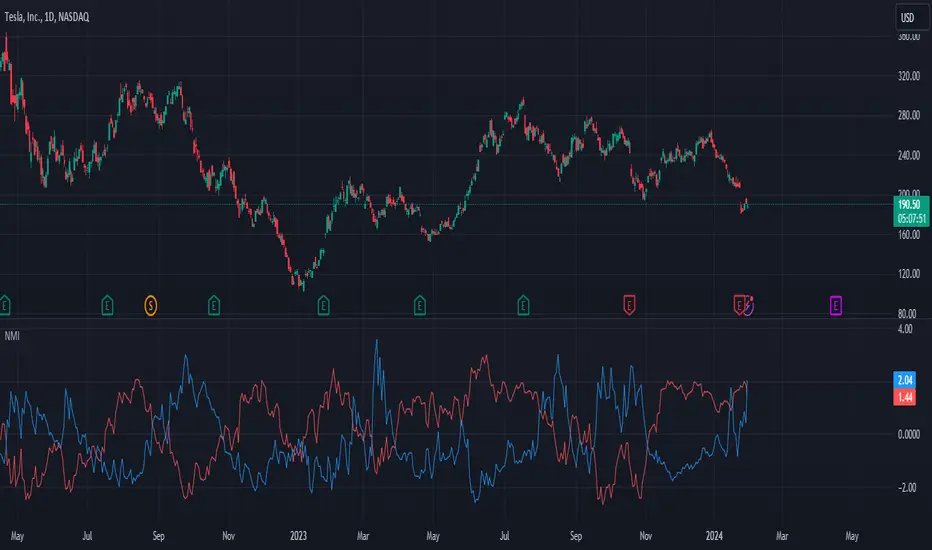
Normalized Market Indicators
Explanation of the Code:
Data Retrieval: The script retrieves the closing prices of the S&P 500 (sp500) and VIX (vix).
Normalization: The script normalizes these values using a simple z-score normalization (subtracting the 50-period simple moving average and dividing by the 50-period standard deviation). This makes the scales of the two datasets more comparable.
Plotting with Secondary Axis: The normalized values of the S&P 500 and VIX are plotted on the same chart. They will share the same y-axis scale as the main chart (e.g. Netflix, GOLD, Forex).
Points to Note:
Normalization Method: The method of normalization (z-score in this case) is a choice and can be adjusted based on your needs. The idea is to bring the data to a comparable scale.
Timeframe and Symbol Codes: Ensure the timeframe and symbol codes are appropriate for your data source and trading strategy.
Overlaying on Price Chart: Since these values are normalized and plotted on a seperate chart, they won't directly correspond to the price levels of the main chart (e.g. Netflix, GOLD, Forex).
Script open-source
Nello spirito di TradingView, l'autore di questo script lo ha reso open source, in modo che i trader possano esaminarne e verificarne la funzionalità. Complimenti all'autore! Sebbene sia possibile utilizzarlo gratuitamente, ricordiamo che la ripubblicazione del codice è soggetta al nostro Regolamento.
Declinazione di responsabilità
Le informazioni e le pubblicazioni non sono intese come, e non costituiscono, consulenza o raccomandazioni finanziarie, di investimento, di trading o di altro tipo fornite o approvate da TradingView. Per ulteriori informazioni, consultare i Termini di utilizzo.