PROTECTED SOURCE SCRIPT
Free Master Trend Navigator/ 趋势大师导航仪(免费版) by Mrlazycat
趋势大师导航仪简单上手版使用说明
(这是一个简单版的趋势大师导航仪;如果需要趋势大师导航仪Pro版,可联系作者懒猫先生进行授权使用【推特联系:Jeffmo0769】)
(This is a simplified version of the Trend Master Navigator. For the Pro version, please contact Mr. Lazy Cat for authorization [Contact on X: Jeffmo0769])
⚠ 非常重要,使用指标前请认真阅读这个使用说明
这是一个简单版的趋势大师导航仪
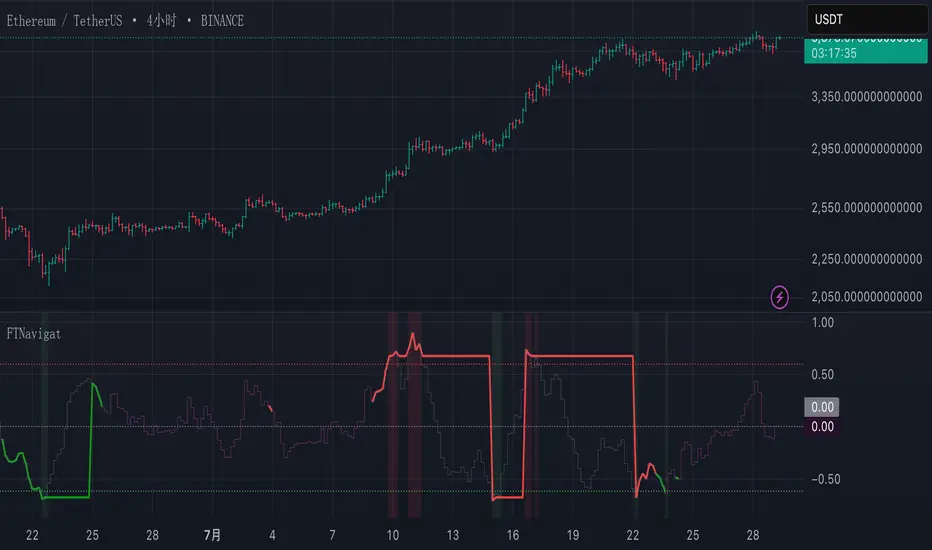
指标核心功能 本指标通过分析比特币的成交量、动能指标(MACD)、相对强弱指数(RSI)、趋势强度和成交量比率,生成在-1到1之间波动的趋势大师导航仪,帮助判断买卖时机。指标最佳适用场为4小时(4H)图表,适合1-2周的中短期交易。该趋势大师导航仪适用于BTC,ETH, DOGE等现货成交量大的虚拟货币
趋势曲线解读指南
① 市场状态(曲线颜色)
暗紫色:区间震荡市场
红色曲线:多头趋势
绿色曲线:空头趋势
② 关键信号区域
红色区域(超买):趋势曲线 ≥ 0.6 时,可能出现回调风险
绿色区域(超卖):趋势曲线 ≤ -0.615 时,可能出现反弹机会
③ 锁定机制
对部分强多头趋势(红色)和强空头趋势(绿色)进行锁定:
如果趋势曲线突破红色区域(超买)且市场趋势强度保持在强趋势或较强的弱趋势,趋势曲线会锁定在0.7附近(原始曲线以灰色继续)。
如果趋势曲线跌破绿色区域(超卖)且市场趋势强度保持在强趋势或较强的弱趋势,趋势曲线会锁定在-0.7附近(原始曲线以灰色继续)。 这表示趋势可能继续发展,建议等待锁定期结束后再进行操作。
✅ 极端多头趋势的特殊案例:(如ETH在2025年7月10日到20日,趋势曲线一直维持红色,意味着多头趋势不变。但这段时间ETH的趋势曲线曾跌到超卖区,因此曲线曾在底部锁定3个K线的时间,这意味着是多头右侧追多的机会。)
交易信号
超买超卖信号+趋势判断
红色区域(超买):趋势曲线 ≥ 0.6 时,可能出现回调风险,注意趋势变化
绿色区域(超卖):趋势曲线 ≤ -0.615 时,可能出现反弹机会,注意趋势变化
使用注意事项
① 交易所推荐:同时使用币安(Binance)和OKX的BTC/USDT现货数据(不同交易所的量能差异可能影响信号准确性)。
② 特殊行情优化:已针对2024-2025年比特币ETF上市后的低波动行情调整参数,未来将持续根据市场变化优化。
③ 强趋势操作提示:当趋势曲线锁定在超买或超卖区,应减少逆势操作。
④ 首次使用建议:观察历史行情以验证信号特征,震荡市捕捉反转点,趋势市识别延续信号。
Trend Master Navigator (Simplified Version) User Guide
⚠ Important: Please read this guide carefully before using the indicator
This is a simplified version of the Trend Master Navigator.
Core Functionality This indicator analyzes Bitcoin's trading volume, MACD, RSI, trend strength, and volume ratio to generate the Trend Master Navigator, which oscillates between -1 and 1 to assist in buy/sell decisions. The indicator is best suited for 4-hour (4H) charts and is ideal for 1-2 week swing trading. The Trend Master Navigator is suitable for cryptocurrencies with high spot trading volumes, such as BTC, ETH, and DOGE.
Interpreting the Trend Curve
① Market States (Curve Colors) Dark Purple: Range-bound market Red Curve: Bullish trend Green Curve: Bearish trend
② Key Signal Zones Red Zone (Overbought): Trend curve ≥ 0.6 → Potential pullback risk Green Zone (Oversold): Trend curve ≤ -0.615 → Potential rebound opportunity
③ Locking Mechanism During strong bullish (red) and strong bearish (green) trends, and partial weak trends:
If the trend curve breaks above the red zone (overbought) and the market trend strength remains in a strong trend or robust weak trend, the trend curve will lock near 0.7 (original curve continues in gray).
If the trend curve breaks below the green zone (oversold) and the market trend strength remains in a strong trend or robust weak trend, the trend curve will lock near -0.7 (original curve continues in gray). This indicates that the trend may continue, and it is advisable to wait until the lock period ends before taking action. ✅ Example of extreme bullish trend: (e.g., ETH from July 10 to 20, 2025, where the trend curve remained red, indicating a persistent bullish trend. During this period, ETH's trend curve dipped into the oversold zone, locking the curve at the bottom for 3 K-line periods, signifying a right-side buying opportunity in the bullish trend.)
Trading Signals
Overbought/Oversold Signals + Trend Judgment
Red Zone (Overbought): Trend curve ≥ 0.6 → Potential pullback risk, pay attention to trend changes
Green Zone (Oversold): Trend curve ≤ -0.615 → Potential rebound opportunity, pay attention to trend changes
Usage Notes
① Exchange Recommendation: Use Binance and OKX BTC/USDT spot data simultaneously (volume discrepancies across different exchanges may affect signal accuracy).
② Special Market Optimization: Parameters have been adjusted for the low-volatility era following the Bitcoin ETF launch (2024-2025) and will continue to be optimized based on market changes.
③ Strong Trend Operation Tips: When the trend curve is locked in overbought or oversold zones, reduce counter-trend operations. ④ First Use Recommendation: Observe historical market trends to validate signal characteristics. Capture reversal points in range-bound markets and identify continuation signals in trending markets.
Contact on X: Jeffmo0769
(这是一个简单版的趋势大师导航仪;如果需要趋势大师导航仪Pro版,可联系作者懒猫先生进行授权使用【推特联系:Jeffmo0769】)
(This is a simplified version of the Trend Master Navigator. For the Pro version, please contact Mr. Lazy Cat for authorization [Contact on X: Jeffmo0769])
⚠ 非常重要,使用指标前请认真阅读这个使用说明
这是一个简单版的趋势大师导航仪
指标核心功能 本指标通过分析比特币的成交量、动能指标(MACD)、相对强弱指数(RSI)、趋势强度和成交量比率,生成在-1到1之间波动的趋势大师导航仪,帮助判断买卖时机。指标最佳适用场为4小时(4H)图表,适合1-2周的中短期交易。该趋势大师导航仪适用于BTC,ETH, DOGE等现货成交量大的虚拟货币
趋势曲线解读指南
① 市场状态(曲线颜色)
暗紫色:区间震荡市场
红色曲线:多头趋势
绿色曲线:空头趋势
② 关键信号区域
红色区域(超买):趋势曲线 ≥ 0.6 时,可能出现回调风险
绿色区域(超卖):趋势曲线 ≤ -0.615 时,可能出现反弹机会
③ 锁定机制
对部分强多头趋势(红色)和强空头趋势(绿色)进行锁定:
如果趋势曲线突破红色区域(超买)且市场趋势强度保持在强趋势或较强的弱趋势,趋势曲线会锁定在0.7附近(原始曲线以灰色继续)。
如果趋势曲线跌破绿色区域(超卖)且市场趋势强度保持在强趋势或较强的弱趋势,趋势曲线会锁定在-0.7附近(原始曲线以灰色继续)。 这表示趋势可能继续发展,建议等待锁定期结束后再进行操作。
✅ 极端多头趋势的特殊案例:(如ETH在2025年7月10日到20日,趋势曲线一直维持红色,意味着多头趋势不变。但这段时间ETH的趋势曲线曾跌到超卖区,因此曲线曾在底部锁定3个K线的时间,这意味着是多头右侧追多的机会。)
交易信号
超买超卖信号+趋势判断
红色区域(超买):趋势曲线 ≥ 0.6 时,可能出现回调风险,注意趋势变化
绿色区域(超卖):趋势曲线 ≤ -0.615 时,可能出现反弹机会,注意趋势变化
使用注意事项
① 交易所推荐:同时使用币安(Binance)和OKX的BTC/USDT现货数据(不同交易所的量能差异可能影响信号准确性)。
② 特殊行情优化:已针对2024-2025年比特币ETF上市后的低波动行情调整参数,未来将持续根据市场变化优化。
③ 强趋势操作提示:当趋势曲线锁定在超买或超卖区,应减少逆势操作。
④ 首次使用建议:观察历史行情以验证信号特征,震荡市捕捉反转点,趋势市识别延续信号。
Trend Master Navigator (Simplified Version) User Guide
⚠ Important: Please read this guide carefully before using the indicator
This is a simplified version of the Trend Master Navigator.
Core Functionality This indicator analyzes Bitcoin's trading volume, MACD, RSI, trend strength, and volume ratio to generate the Trend Master Navigator, which oscillates between -1 and 1 to assist in buy/sell decisions. The indicator is best suited for 4-hour (4H) charts and is ideal for 1-2 week swing trading. The Trend Master Navigator is suitable for cryptocurrencies with high spot trading volumes, such as BTC, ETH, and DOGE.
Interpreting the Trend Curve
① Market States (Curve Colors) Dark Purple: Range-bound market Red Curve: Bullish trend Green Curve: Bearish trend
② Key Signal Zones Red Zone (Overbought): Trend curve ≥ 0.6 → Potential pullback risk Green Zone (Oversold): Trend curve ≤ -0.615 → Potential rebound opportunity
③ Locking Mechanism During strong bullish (red) and strong bearish (green) trends, and partial weak trends:
If the trend curve breaks above the red zone (overbought) and the market trend strength remains in a strong trend or robust weak trend, the trend curve will lock near 0.7 (original curve continues in gray).
If the trend curve breaks below the green zone (oversold) and the market trend strength remains in a strong trend or robust weak trend, the trend curve will lock near -0.7 (original curve continues in gray). This indicates that the trend may continue, and it is advisable to wait until the lock period ends before taking action. ✅ Example of extreme bullish trend: (e.g., ETH from July 10 to 20, 2025, where the trend curve remained red, indicating a persistent bullish trend. During this period, ETH's trend curve dipped into the oversold zone, locking the curve at the bottom for 3 K-line periods, signifying a right-side buying opportunity in the bullish trend.)
Trading Signals
Overbought/Oversold Signals + Trend Judgment
Red Zone (Overbought): Trend curve ≥ 0.6 → Potential pullback risk, pay attention to trend changes
Green Zone (Oversold): Trend curve ≤ -0.615 → Potential rebound opportunity, pay attention to trend changes
Usage Notes
① Exchange Recommendation: Use Binance and OKX BTC/USDT spot data simultaneously (volume discrepancies across different exchanges may affect signal accuracy).
② Special Market Optimization: Parameters have been adjusted for the low-volatility era following the Bitcoin ETF launch (2024-2025) and will continue to be optimized based on market changes.
③ Strong Trend Operation Tips: When the trend curve is locked in overbought or oversold zones, reduce counter-trend operations. ④ First Use Recommendation: Observe historical market trends to validate signal characteristics. Capture reversal points in range-bound markets and identify continuation signals in trending markets.
Contact on X: Jeffmo0769
Script protetto
Questo script è pubblicato come codice protetto. Tuttavia, è possibile utilizzarle liberamente e senza alcuna limitazione – ulteriori informazioni qui.
Declinazione di responsabilità
Le informazioni e le pubblicazioni non sono intese come, e non costituiscono, consulenza o raccomandazioni finanziarie, di investimento, di trading o di altro tipo fornite o approvate da TradingView. Per ulteriori informazioni, consultare i Termini di utilizzo.